


软件

产品


plot(X,Y) creates a 2-D line plot of the data in Y versus the corresponding values in X.
plot(X,Y)为Y中的数据与X中的相应数值创建一个二维线图。
如果X和Y都是向量,那么它们必须有相同的长度。plot函数绘制了Y与X的对比图。
如果X和Y都是矩阵,那么它们必须有相同的大小。plot函数绘制了Y的列与X的列的对比图。
如果X或Y中的一个是 矢量 ,另一个是矩阵,那么矩阵的尺寸必须是其中一个尺寸等于矢量的长度。如果矩阵的行数等于矢量的长度,那么绘图函数就会绘制每个矩阵列与矢量的对比。如果矩阵的列数等于矢量的长度,那么该函数就会绘制每一行与矢量的对比图。如果矩阵是正方形,则函数绘制每一列与矢量的关系。
如果X或Y中的一个是标量,另一个是标量或矢量,那么绘图函数就会绘制出离散的点。然而,为了看到这些点,你必须指定一个标记符号,例如,plot(X,Y,‘o’)。
例1
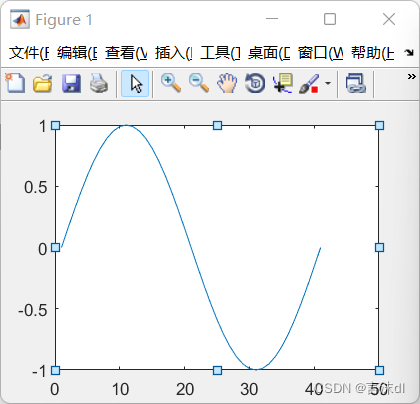
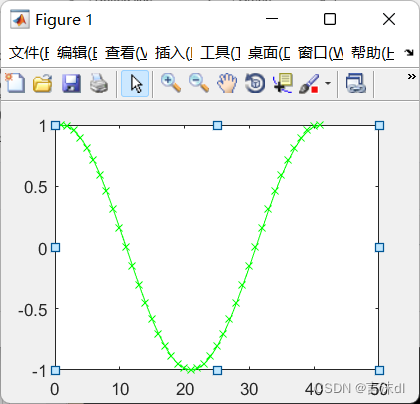
>> plot(cos(0:pi/20:2*pi));
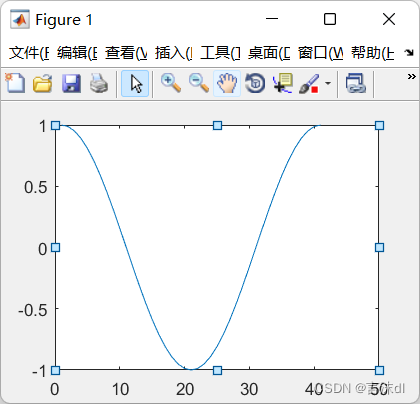
>> plot(sin(0:pi/20:2*pi));
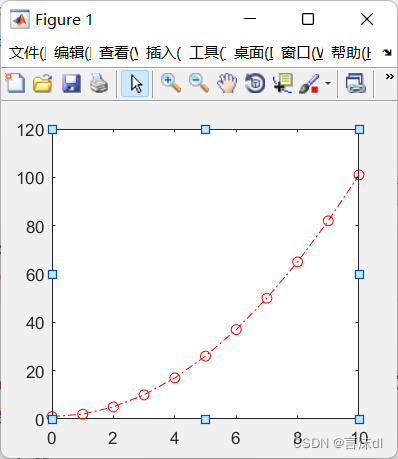
>>  x=0:1:10;y=x.^2+1;
plot(x,y,'or-.');
matlab画图,一般下两次指令, matlab 执行到第二次画图时,会覆盖第一张图,解决办法如下:
hold on/off
添加绘图时,保留当前绘图,不会对原有图形进行覆盖。
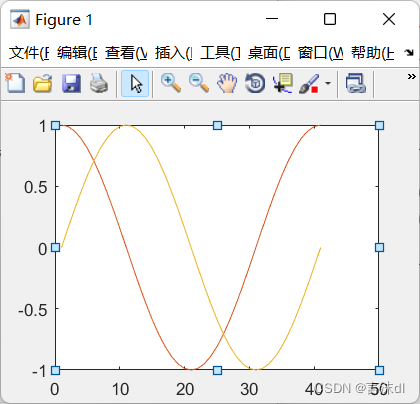
>> hold on
plot(cos(0:pi/20:2*pi));
plot(sin(0:pi/20:2*pi));
hold off
plot(x,y,‘str’)
可以对图形进行更详细的标注,可以对图形的线段、颜色等进行修改
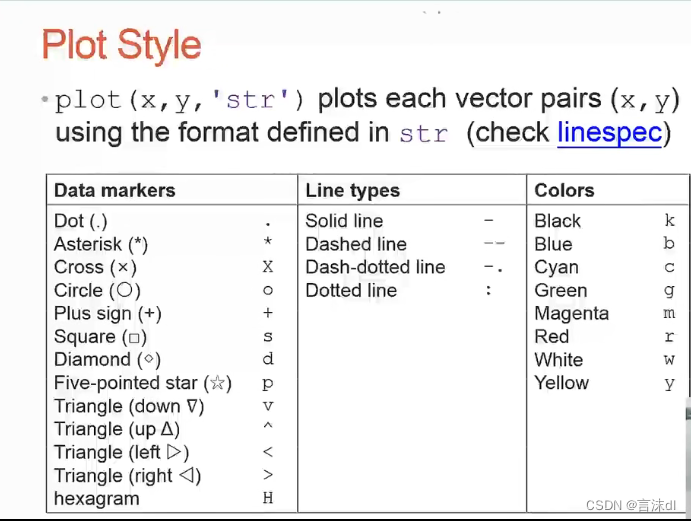
绘制图形时,可以更改图形的属性
>> plot(cos(0:pi/20:2*pi),'Xg-');
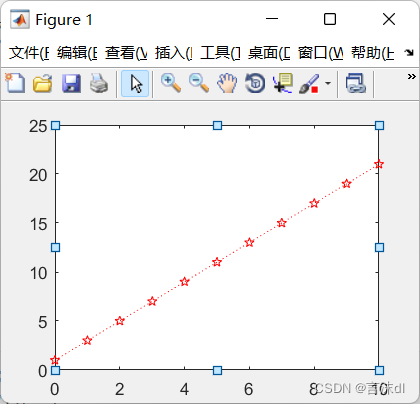
>> x=[0:1:10];
plot(x,2*x+1,'rp:');
用Matlab画图时,有时候需要对各种图标进行标注,例如,用“+”代表A的运动情况,“*”代表B的运动情况。 legend函数的基本用法是: legend(string1,string2,string3, …) 分别将字符串1、字符串2、字符串3……标注到图中,每个字符串对应的图标为画图时的图标。
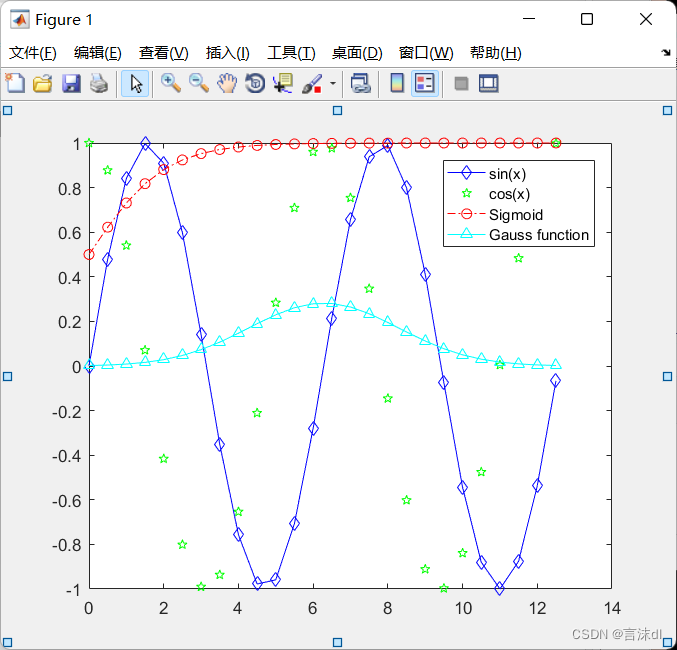
>> x=0:0.5:4*pi;
y=sin(x);h=cos(x);w=1./(1+exp(-x));
g=(1/(2*pi*2)^0.5).*exp((-1.*(x-2*pi).^2)./(2*2^2));
plot(x,y,'bd-',x,h,'gp',x,w,'ro-.',x,g,'c^-');
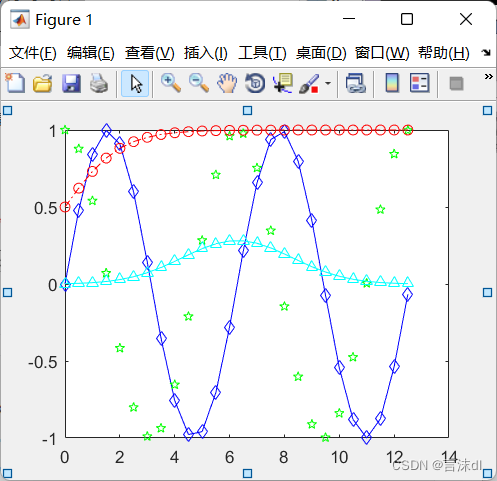
加上下面的一行代码
>> legend('sin(x)','cos(x)','Sigmoid','Gauss function');
绘制图形的标题和坐标轴标签
title()、xlabel()、ylabel()、zlabel()
>> x=0:0.1:2*pi;y1=sin(x);y2=exp(-x);
plot(x,y1,'--*',x,y2,':o');
xlabel('t=0 to 2\pi');
ylabel('values of sin(t) and e^{-x}');
title('Function Plots of sin(t) and e^{-x}');
legend('sin(t)','e^{-x}');
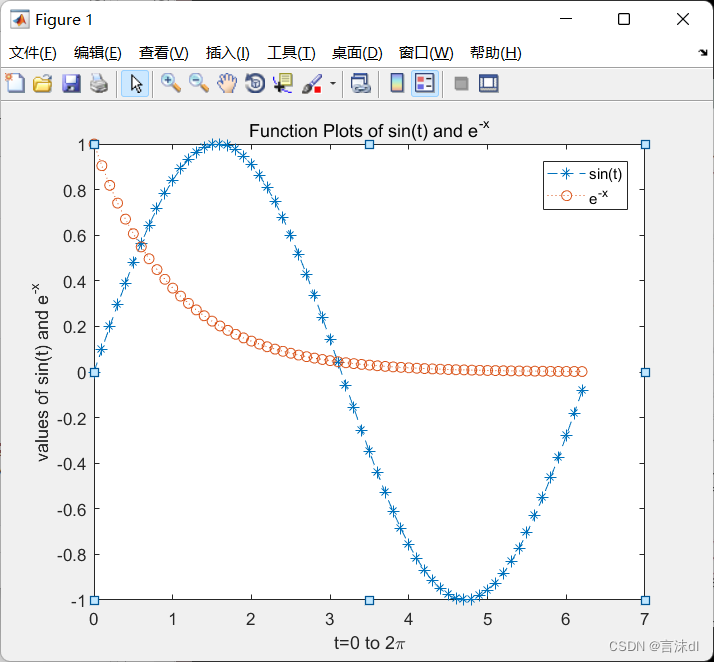
**注解:**其中xlabel(‘t=0 to 2\pi’) “\pi”代表Π,如果不加“\”,则表示的是Π;e^{-x}特殊字源
text()函数表示向数据点添加文本说明;
https://blog.csdn.net/jk_101/article/details/110727188
annotation()表示给绘制的图形进行注释。
https://blog.csdn.net/jk_101/article/details/110731532
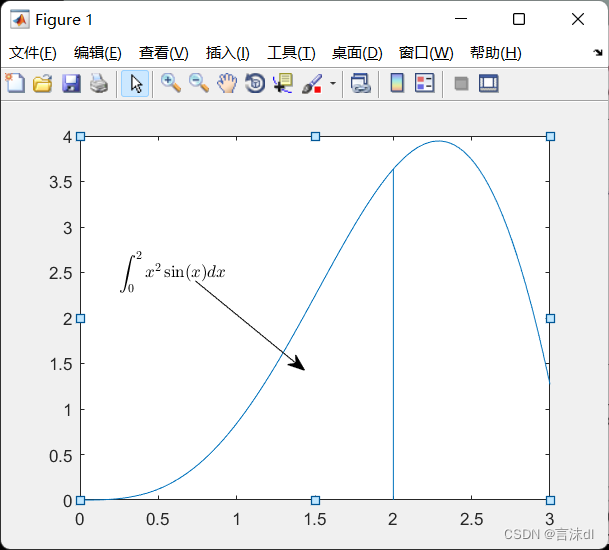
x=linspace(0,3);y=x.^2.*sin(x);plot(x,y);
line([2,2],[0,2^2*sin(2)]);
str='$$ \int_{0}^{2} x^2\sin(x) dx $$';
text(0.25,2.5,str,'Interpreter','latex');
annotation('arrow','X',[0.32,0.5],'Y',[0.6,0.4]);
注解:
练习:
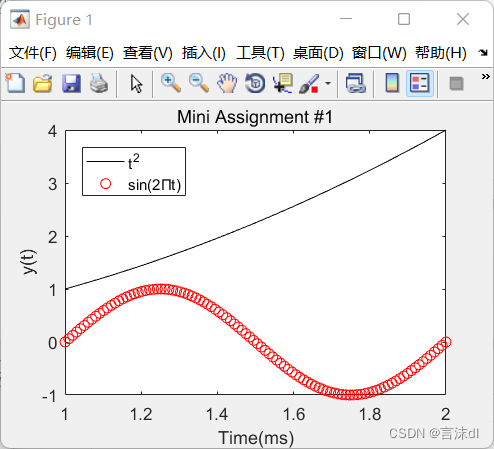
>> x=linspace(1,2);y1=x.^2;y2=sin(2*pi*x);
plot(x,y1,'k-',x,y2,'ro');
xlabel('Time(ms)');
ylabel('y(t)');
title('Mini Assignment #1');
legend('t^2','sin(2Πt)','Location','northwest');
图形调整
Font
Font Size
Line width
Axis limit
Tick position
Tick label
>> x=linspace(0,2*pi,1000);y=sin(x);
plot(x,y);set(gcf,'Color',[1 1 1]);
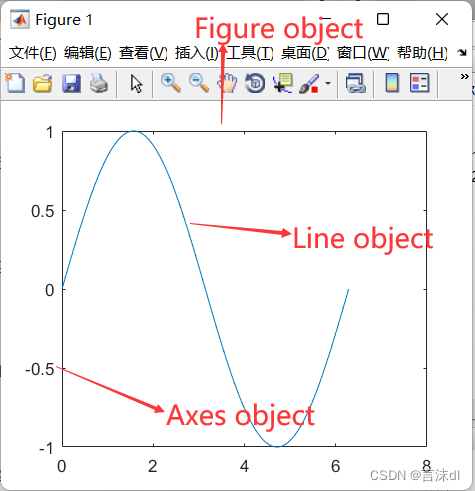
Figure画布,Axes坐标轴,Line图形的线条
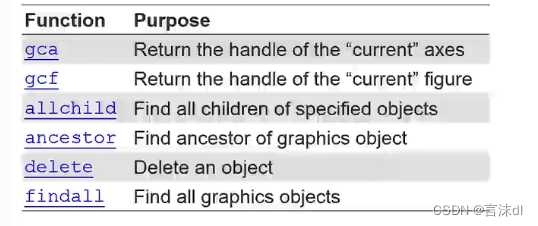
用 get ()和set()来添加和修改图形的属性
x=linspace(0,2*pi,1000); y=sin(x);plot(x,y); h=plot(x,y);get(h);
AlignVertexCenters: 'off'
            Annotation: [1x1 matlab.graphics.eventdata.Annotation]
          BeingDeleted: 'off'
            BusyAction: 'queue'
         ButtonDownFcn: ''
              Children: [0x0 GraphicsPlaceholder]
              Clipping: 'on'
                 Color: [0 0.4470 0.7410]
             CreateFcn: ''
             DeleteFcn: ''
           DisplayName: ''
      HandleVisibility: 'on'
               HitTest: 'on'
         Interruptible: 'on'
              LineJoin: 'round'
             LineStyle: '-'
             LineWidth: 0.5000
                Marker: 'none'
       MarkerEdgeColor: 'auto'
       MarkerFaceColor: 'none'
            MarkerSize: 6
                Parent: [1x1 Axes]
         PickableParts: 'visible'
              Selected: 'off'
    SelectionHighlight: 'on'
                   Tag: ''
                  Type: 'line'
         UIContextMenu: [0x0 GraphicsPlaceholder]
              UserData: []
               Visible: 'on'
                 XData: [1x1000 double]
             XDataMode: 'manual'
           XDataSource: ''
                 YData: [1x1000 double]
           YDataSource: ''
                 ZData: [1x0 double]
           ZDataSource: ''
get(gca)
                       ALim: [0 1]
                   ALimMode: 'auto'
     ActivePositionProperty: 'outerposition'
          AmbientLightColor: [1 1 1]
               BeingDeleted: 'off'
                        Box: 'on'
                   BoxStyle: 'back'
                 BusyAction: 'queue'
              ButtonDownFcn: ''
                       CLim: [0 1]
                   CLimMode: 'auto'
             CameraPosition: [3.5000 0 17.3205]
         CameraPositionMode: 'auto'
               CameraTarget: [3.5000 0 0]
           CameraTargetMode: 'auto'
             CameraUpVector: [0 1 0]
         CameraUpVectorMode: 'auto'
            CameraViewAngle: 6.6086
        CameraViewAngleMode: 'auto'
                   Children: [1x1 Line]
                   Clipping: 'on'
              ClippingStyle: '3dbox'
                      Color: [1 1 1]
                 ColorOrder: [7x3 double]
            ColorOrderIndex: 2
                  CreateFcn: ''
               CurrentPoint: [2x3 double]
            DataAspectRatio: [3.5000 1 1]
        DataAspectRatioMode: 'auto'
                  DeleteFcn: ''
                  FontAngle: 'normal'
                   FontName: 'Helvetica'
                   FontSize: 10
              FontSmoothing: 'on'
                  FontUnits: 'points'
                 FontWeight: 'normal'
                  GridAlpha: 0.1500
              GridAlphaMode: 'auto'
                  GridColor: [0.1500 0.1500 0.1500]
              GridColorMode: 'auto'
              GridLineStyle: '-'
           HandleVisibility: 'on'
                    HitTest: 'on'
              Interruptible: 'on'
    LabelFontSizeMultiplier: 1.1000
                      Layer: 'bottom'
             LineStyleOrder: '-'
        LineStyleOrderIndex: 1
                  LineWidth: 0.5000
             MinorGridAlpha: 0.2500
         MinorGridAlphaMode: 'auto'
             MinorGridColor: [0.1000 0.1000 0.1000]
         MinorGridColorMode: 'auto'
         MinorGridLineStyle: ':'
                   NextPlot: 'replace'
              OuterPosition: [0 0 1 1]
                     Parent: [1x1 Figure]
              PickableParts: 'visible'
         PlotBoxAspectRatio: [1 0.7882 0.7882]
     PlotBoxAspectRatioMode: 'auto'
                   Position: [0.1300 0.1100 0.7750 0.8150]
                 Projection: 'orthographic'
                   Selected: 'off'
         SelectionHighlight: 'on'
                 SortMethod: 'childorder'
                        Tag: ''
                    TickDir: 'in'
                TickDirMode: 'auto'
       TickLabelInterpreter: 'tex'
                 TickLength: [0.0100 0.0250]
                 TightInset: [0.0524 0.0546 0.0071 0.0210]
                      Title: [1x1 Text]
    TitleFontSizeMultiplier: 1.1000
            TitleFontWeight: 'normal'
                       Type: 'axes'
              UIContextMenu: [0x0 GraphicsPlaceholder]
                      Units: 'normalized'
                   UserData: []
                       View: [0 90]
                    Visible: 'on'
                      XAxis: [1x1 NumericRuler]
              XAxisLocation: 'bottom'
                     XColor: [0.1500 0.1500 0.1500]
                 XColorMode: 'auto'
                       XDir: 'normal'
                      XGrid: 'off'
                     XLabel: [1x1 Text]
                       XLim: [0 7]
                   XLimMode: 'auto'
                 XMinorGrid: 'off'
                 XMinorTick: 'off'
                     XScale: 'linear'
                      XTick: [0 1 2 3 4 5 6 7]
                 XTickLabel: {8x1 cell}
             XTickLabelMode: 'auto'
         XTickLabelRotation: 0
                  XTickMode: 'auto'
                      YAxis: [1x1 NumericRuler]
              YAxisLocation: 'left'
                     YColor: [0.1500 0.1500 0.1500]
                 YColorMode: 'auto'
                       YDir: 'normal'
                      YGrid: 'off'
                     YLabel: [1x1 Text]
                       YLim: [-1 1]
                   YLimMode: 'auto'
                 YMinorGrid: 'off'
                 YMinorTick: 'off'
                     YScale: 'linear'
                      YTick: [1x11 double]
                 YTickLabel: {11x1 cell}
             YTickLabelMode: 'auto'
         YTickLabelRotation: 0
                  YTickMode: 'auto'
                      ZAxis: [1x1 NumericRuler]
                     ZColor: [0.1500 0.1500 0.1500]
                 ZColorMode: 'auto'
                       ZDir: 'normal'
                      ZGrid: 'off'
                     ZLabel: [1x1 Text]
                       ZLim: [-1 1]
                   ZLimMode: 'auto'
                 ZMinorGrid: 'off'
                 ZMinorTick: 'off'
                     ZScale: 'linear'
                      ZTick: [-1 0 1]
                 ZTickLabel: ''
             ZTickLabelMode: 'auto'
         ZTickLabelRotation: 0
                  ZTickMode: 'auto'
练习:
修改某一个值(属性),结果为去掉红色空白部分
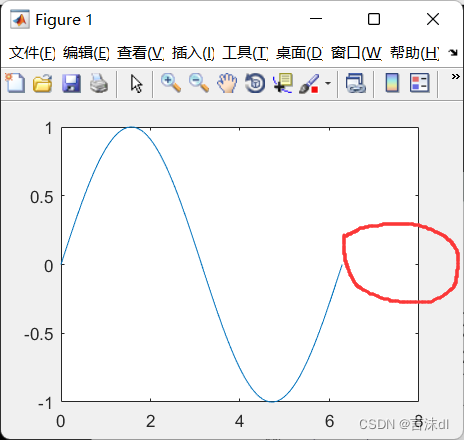
输入下列两行,(二者同样的效果)可以实现上述结果:
set(gca,‘XLim’,[0,2*pi]); set(gca,‘YLim’,[-1.2,1.2]);
or
xlim([0,2*pi]); ylim([-1,1]);
改变坐标轴的大小
>> set(gca,'fontSize',25);
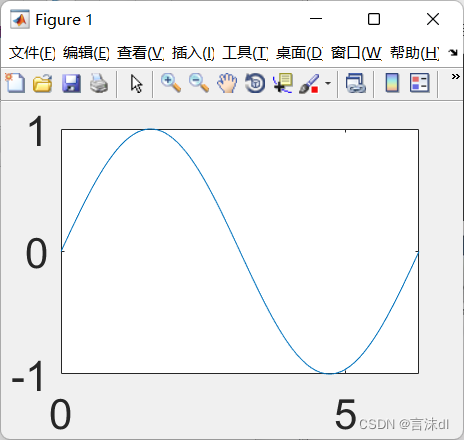
把X轴的取值改为0,Π/2,Π,…
>> set(gca,'XTick',0:pi/2:2*pi);
set(gca,'XtickLabel',0:90:360);
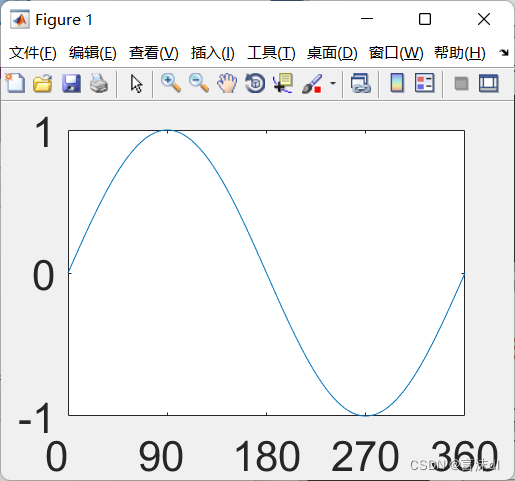
在这一过程中,Matlab中对于特殊符号会显示不出来,例如π,因为matlab不支持symbol格式,我们可以用string代替symbol,这样就可以把π显示出来了。以下两种形式都可以。
>>set(gca,'FontName','string');
set(gca,'XTickLabel',{'0','π/2','π','3π/2','2π'});
>>set(gca,'FontName','string');
set(gca,'XTickLabel',{'0','\pi/2','\pi','3\pi/2','2\pi'});
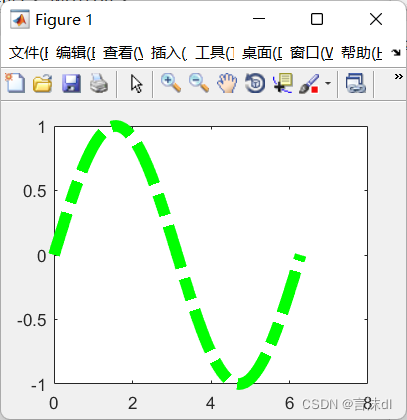
Line style and width:
>>x=linspace(0,2*pi,1000); y=sin(x);plot(x,y); h=plot(x,y); set(gca,'FontName','char'); set(gca,'XTickLabel',{'0','π/2','π','3π/2','2π'}); set(h,'LineStyle','-.',... 'LineWidth',7.0,'Color','g'); 一键获取完整项目代码1234567
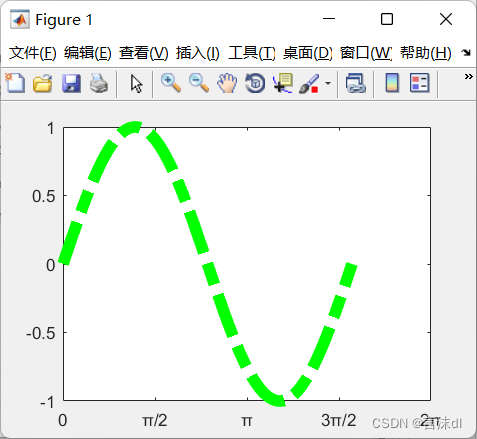
如果用plot来输出,去掉h,则图形是什么样的呢?
>>plot(x,y,'-.g',...
'LineWidth',7.0);
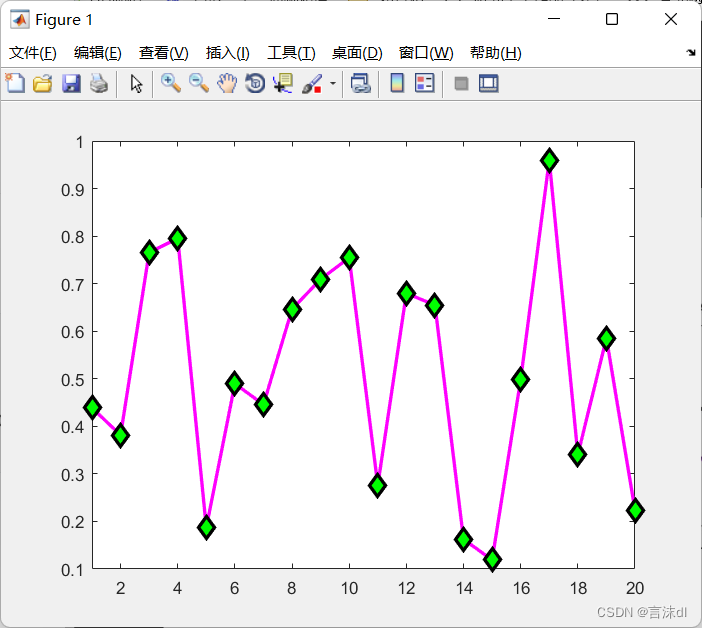
标记点
练习:
>> x=rand(20,1);set(gca,'FontSize',18);
plot(x,'-md','LineWidth',2,'MarkerEdgeColor','K',...
'MarkerFaceColor','g','MarkerSize',10);xlim([1,20]);
注解:
matlab中的 rand函数 (用于产生随机数)均匀分布的随机数或矩阵
语法
Y = rand(n)
Y = rand(m,n)
Y = rand([m n])
Y = rand(m,n,p,…)
Y = rand([m n p…])
Y = rand(size(A))
rand
s = rand(‘state’)
描述
rand函数产生由在(0, 1)之间均匀分布的随机数组成的数组。
Y = rand(n) 返回一个nxn的随机矩阵。如果n不是数量,则返回错误信息。
Y = rand(m,n) 或 Y = rand([m n]) 返回一个mxn的随机矩阵。
Y = rand(m,n,p,…) 或 Y = rand([m n p…]) 产生随机数组。
Y = rand(size(A)) 返回一个和A有相同尺寸的随机矩阵。
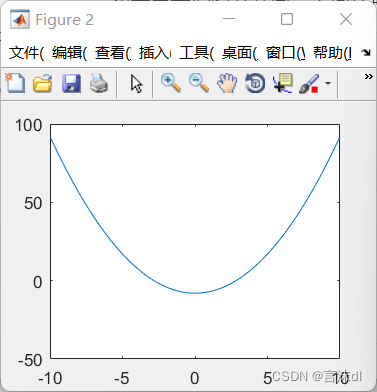
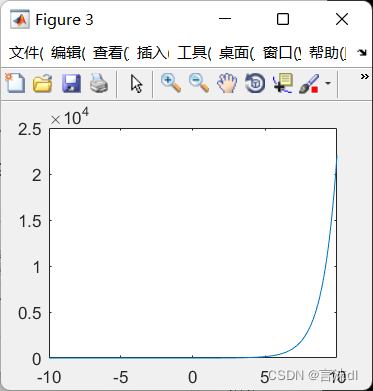
如果需要把图分开画,下面代码可以实现:
>> x=-10:0.1:10;
y1=x.^2-8;
y2=exp(x);
figure,plot(x,y1);
figure,plot(x,y2);
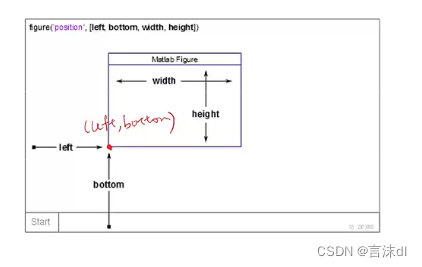
注意,gcf在修改的过程中,可能不是想要的结果
可以用
figure(‘Position’,[left,bottom,width,height]);
这样修改图式的话,就不容易出错了!!
免责声明:本文系网络转载或改编,未找到原创作者,版权归原作者所有。如涉及版权,请联系删
 技术文档
技术文档
 推荐好文
推荐好文


 155-2731-8020


