


软件

产品


原始参考链接
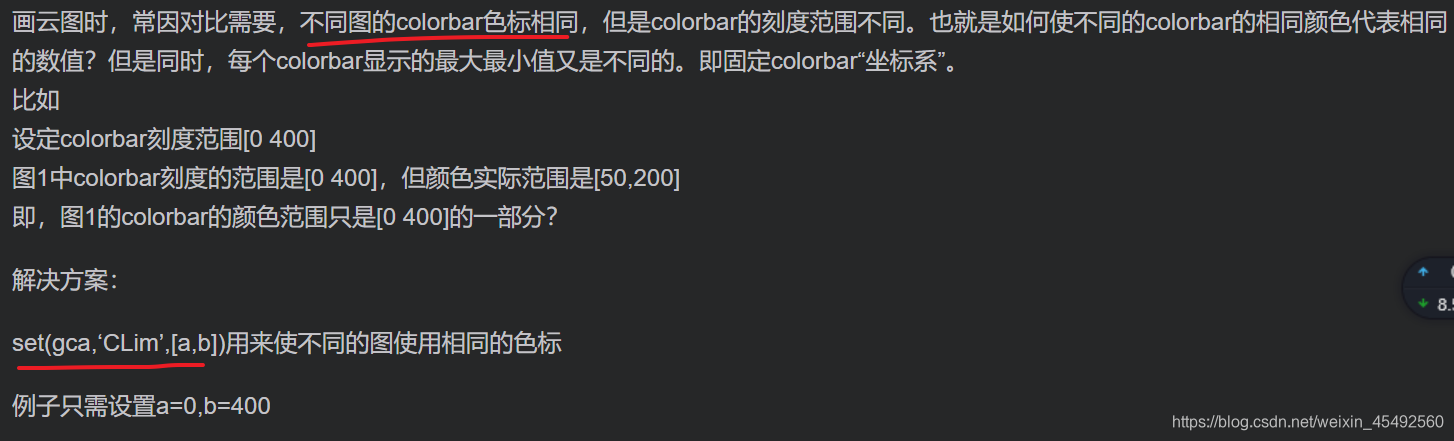
必须要有这个设置
不然colorbar是变化的
子图1设置
caxis([-0.5,0.5]);
colormap(jet);
自己在这块先设置显示的范围,以及选用 jet
最后再单独开个axes,添加colorbar
有几个做colorbar图做的不错的
clc, clear, close all;

top_margin = 0.03; % top margin
btm_margin = 0.03; % bottom margin
left_margin = 0.03;% left margin
right_margin = 0.15;% right margin

fig_margin = 0.08; % margin beween figures(sub)

row = 4; % rows
col = 3; % cols

% Generate some test data to show
x = 0 : 1: 6;
y = 0 : 1.5: 9;

f = y' * x;

% '54' and '0' respectively represent max(f) and min(f)
% both need to be calculated or traversed to determine
% for convenience, I directly use results
clim = [0 54];

% Calculate figure height and width according to rows and cols
fig_h = (1- top_margin - btm_margin - (row-1) * fig_margin) / row;
fig_w = (1 - left_margin - right_margin - (col-1) * fig_margin) / col;

for i = 1 : row
    for j = 1 : col
        % figure position: you can refer to 'help axes' to review the
        % parameter meaning, note that original point is lower-left
        position = [left_margin + (j-1)*(fig_margin+fig_w), ...
           1- (top_margin + i * fig_h + (i-1) * fig_margin), ...
           fig_w, fig_h]
       axes('position', position)
       % draw colorful pictures...
       imagesc(f, clim);

       % title, labels
       title(['fig
免责声明:本文系网络转载或改编,未找到原创作者,版权归原作者所有。如涉及版权,请联系删
 技术文档
技术文档
 推荐好文
推荐好文


 155-2731-8020


