


软件

产品


一般来说学校对于学术论文的图像都有一定的要求,比如线性、字体大小等。
那么,如何画出高清的图和绘制符合要求的图?
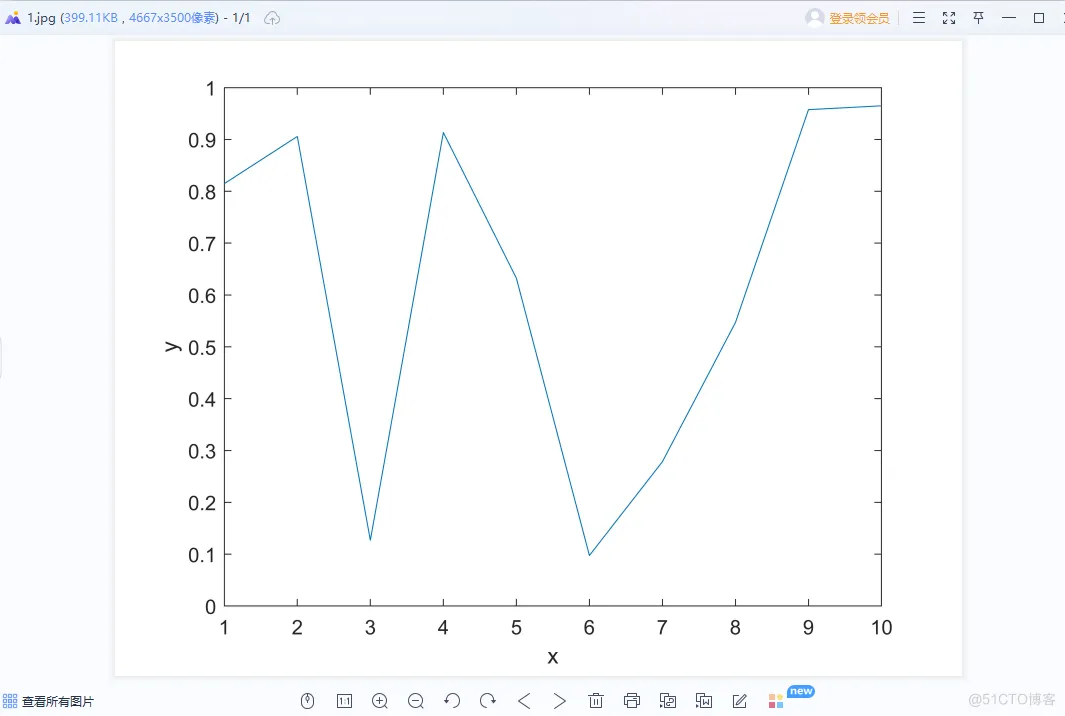
x = 1:10;y = rand(1,length(x));figureplot(x,y)xlabel xylabel yprint 1.jpg -djpeg -r8001.2.3.4.5.6.7.8.可以把仿真图输出高清的jpg文件,像素达到800
x = 1:10;y = rand(1,length(x));y1 = rand(1,length(x));figureplot(x,y,'r',x,y1,'b--','LineWidth',2);l1 = legend('y','y1','location','best');set(l1,'Fontname', '宋体','FontWeight','bold','FontSize',24)xlabel('x','Fontname', '宋体','FontWeight','bold','fontsize',24);ylabel('y','Fontname', '宋体','FontWeight','bold','fontsize',24);set(gcf,'color','w');set(gcf,'color','w');% 实现背景为白色1.2.3.4.5.6.7.8.9.10.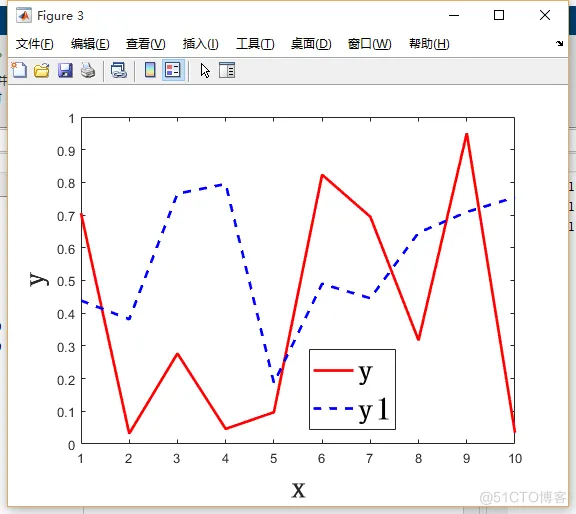
绘制特定长宽的图片格式
x = 1:10;y = rand(1,length(x));y1 = rand(1,length(x));figure1 = figure('Color',[1 1 1]);axes1 = axes('Parent',figure1,'FontSize',24);set (gca,'position',[0.07,0.15,0.9,0.76] )plot(x,y,'r',x,y1,'b--','LineWidth',2);l1 = legend('y','y1','location','best');set(l1,'Fontname', '宋体','FontWeight','bold','FontSize',24)xlabel('x','Fontname', '宋体','FontWeight','bold','fontsize',24);ylabel('y','Fontname', '宋体','FontWeight','bold','fontsize',24);set(gcf,'color','w');set (gcf,'position',[100 0 1800 640] )1.2.3.4.5.6.7.8.9.10.11.12.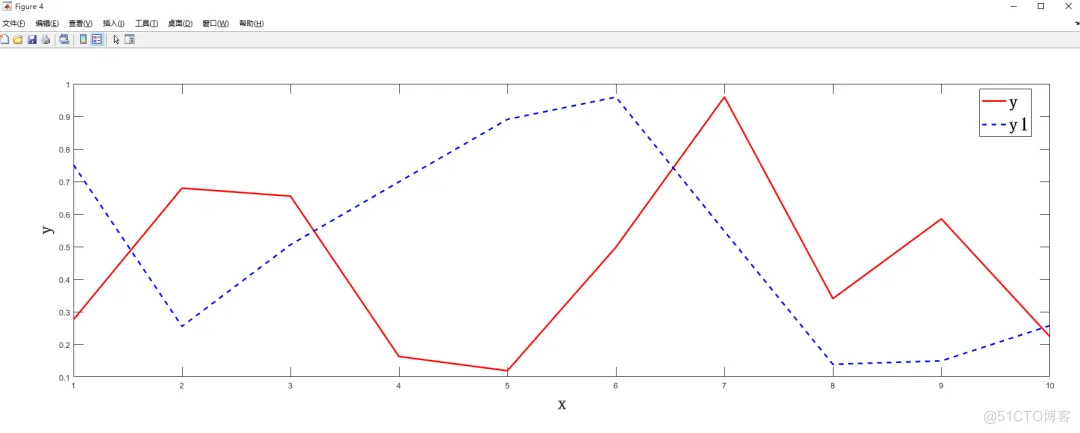
Matlab官方列出来的Tex代码列表
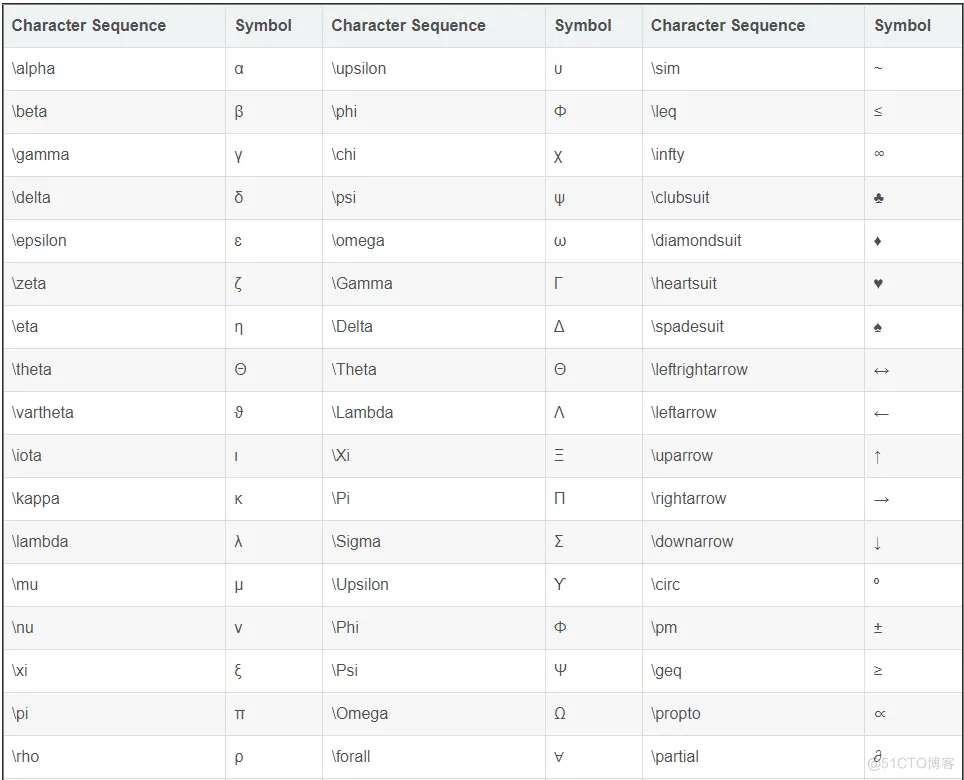
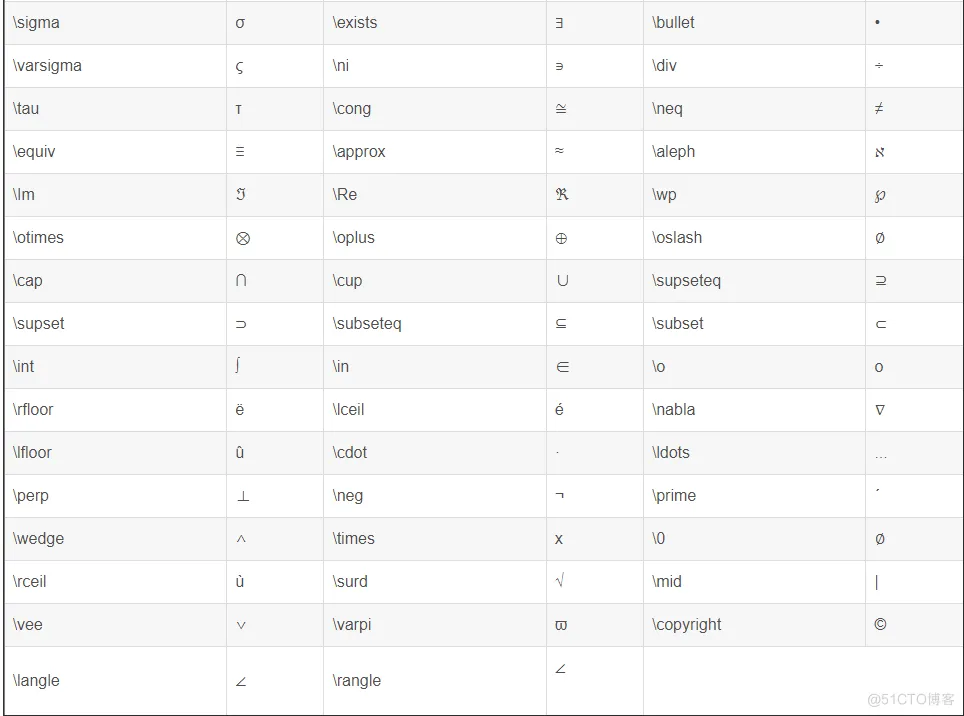
x = 1:10;y = rand(1,length(x));figureplot(x,y)xlabel \betaylabel \alphaset(gcf,'color','w');1.2.3.4.5.6.7.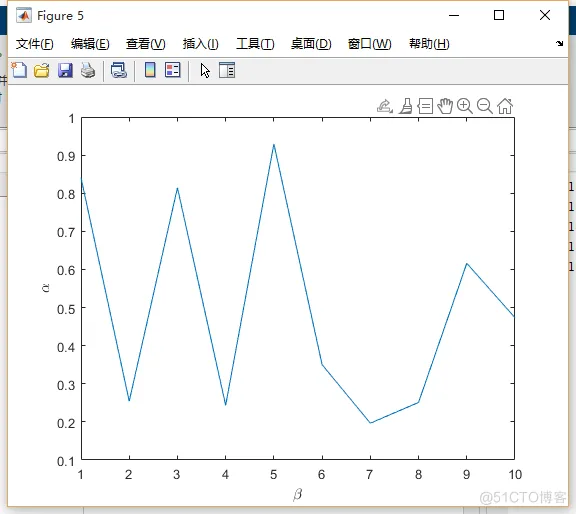
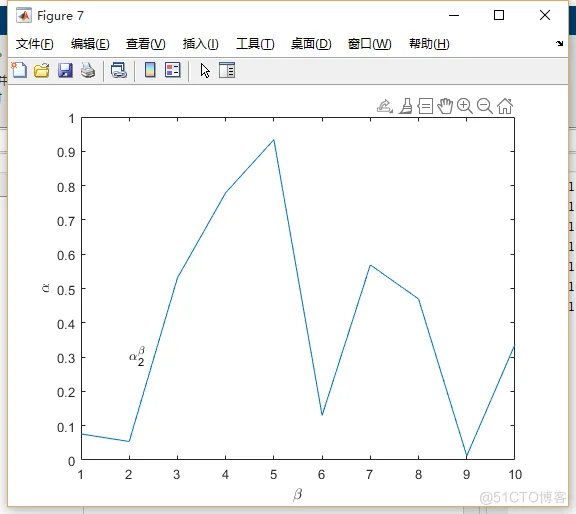
text(2,3,'\alpha_2^\beta') it\w(x):mm,要求w(x)是斜体,而:mm不要求斜体{it\w(x)}:mm,把要设置成斜体的用大括号放在一起1.2.3.注:可用{}把须放在一起的括起来
| 字符串 | 符号 | 字符串 | 符号 | |
| \approx | ≈ | \geq | ≥ | |
| \oplus | ≡ | \pm | ± | |
| \neq | ≠ | \times | × | |
| \leq | ≤ | \div | ÷ | |
| \int | ∫ | \exists | ∝ | |
| \infty | ∞ | \in | ∈ | |
| \sim | ≌ | \forall | ~ | |
| \angle | ∠ | \perp | ⊥ | |
| \cup | ∪ | \cap | ∩ | |
| \vee | ∨ | \wedge | ∧ | |
| \surd | \otimes | |||
| \oplus | \uparrow | ↑ | ||
| \downarrow | ↓ | \rightarrow | → | |
| \leftarrow | ← |
文字标注是图形修饰中的重要因素,它可以是用户在窗口上随意添加的字符说明,还可以是坐标轴对象中所用到的刻度标志等。字符对象的常用属性如下:
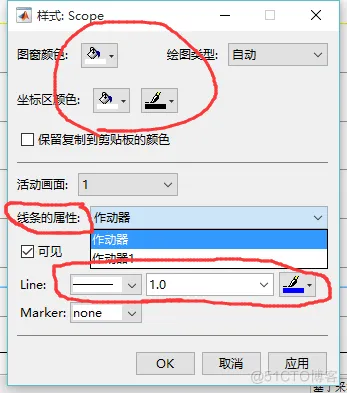
图修改为白底的
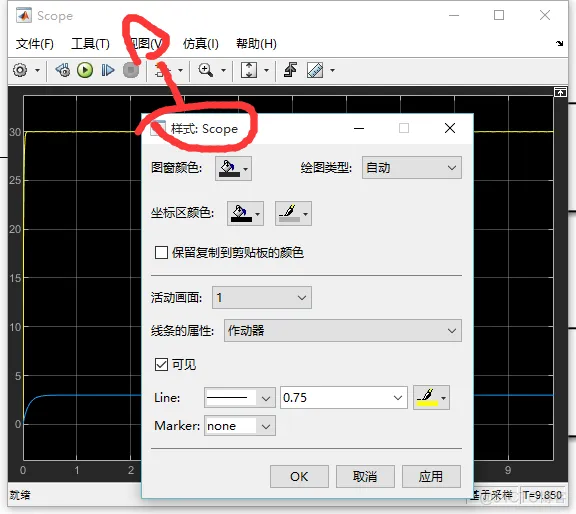
选择scope的视图-->样式。修改图窗颜色和坐标区颜色,然后选择线条的属性,分别修改两条线的颜色、宽度、线形、marker之类的
————————END————————
免责声明:本文系网络转载或改编,未找到原创作者,版权归原作者所有。如涉及版权,请联系删
武汉格发信息技术有限公司,格发许可优化管理系统可以帮你评估贵公司软件许可的真实需求,再低成本合规性管理软件许可,帮助贵司提高软件投资回报率,为软件采购、使用提供科学决策依据。支持的软件有: CAD,CAE,PDM,PLM,Catia,Ugnx, AutoCAD, Pro/E, Solidworks 等。
 技术文档
技术文档
 推荐好文
推荐好文


 155-2731-8020


