



软件

产品

Vectors must be the same length 弹出来的时候先 length(x) 和 length(y) 打出来看一眼,两个数组长度不一致,plot 直接报错,转置一下 x 或者 y 再画。基本命令先列一排,plot(x,y)、plot(x,y,'r--o')、hold on、hold off、figure、close all、clf、cla、clc、gcf、gca、ginput、drawnow。线型符号记几个常用的,'-' 实线,'--' 虚线,':' 点线,'-.' 点划线,标记 'o' 圆,'+' 加号,'*' 星号,'.' 点,'x' 叉,'s' 方块,'d' 菱形,'^' 上三角,'v' 下三角,'>' 右三角,'<' 左三角,'p' 五角星,'h' 六角星。颜色简写 r g b c m y k w,顺序别记反,k 是黑 w 是白。
图形窗口和子图,figure('Position',[100 100 800 600]) 定窗口位置和大小,subplot(2,2,1) 老写法,tiledlayout(2,2) 加 nexttile 新写法,sgtitle('总标题') 给整张图加标题。坐标轴命令,xlim([0 10])、ylim([-5 5])、axis([0 10 -5 5])、axis equal、axis tight、axis off、xticks(0:2:10)、yticks、xticklabels({'0','2','4'})、xtickangle(45)、ytickformat('%.2f')。网格 grid on、grid minor、box on、box off。标签和标题,xlabel('Time (s)')、ylabel('Speed (mm/s)')、zlabel、title('...','FontSize',14)、legend('A','B','C','Location','best')、legend('boxoff')、legend('Color','none')、set(gca,'FontSize',12,'FontName','SimHei')。
双纵轴用 yyaxis left 画左轴,yyaxis right 画右轴,ax = gca,ax.YAxis(1).Color 和 ax.YAxis(2).Color 分别改颜色,左轴蓝右轴红,曲线颜色跟着轴走。统计图,bar(x,y)、barh、histogram(data,20)、scatter(x,y,10,'filled')、errorbar(x,y,err)、boxplot(data)、pie(data)、polarplot(theta,rho)、polarscatter、polarhistogram。三维图,plot3(x,y,z)、mesh(X,Y,Z)、surf(X,Y,Z)、contour(X,Y,Z,20)、contour3、quiver3、slice、isosurface、patch、shading interp、colormap turbo、colorbar、view(3)、camlight、lighting gouraud。
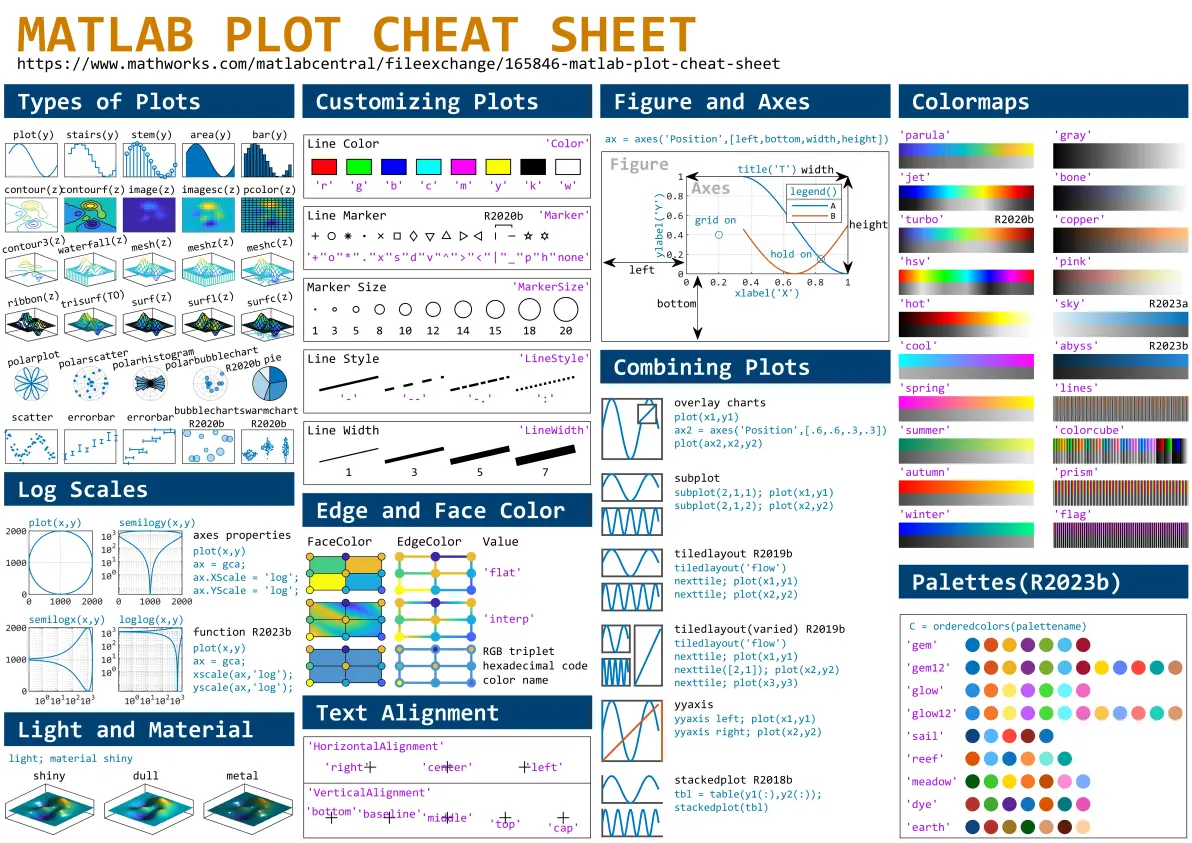
引自github上slandarer的MATLAB-PLOT-CHEAT-SHEET
导出图片,exportgraphics(gcf,'D:\Matlab_work\out\fig1.png','Resolution',600),PDF 用 exportgraphics(gcf,'fig1.pdf','ContentType','vector'),老版本用 print(gcf,'-dpng','-r600','fig1.png'),saveas(gcf,'fig1.fig') 存成可再编辑的 fig 文件,openfig('fig1.fig') 打开。保存之前 set(gcf,'Color','w') 把背景刷白,不然默认灰底打印费墨。copygraphics(gca) 直接进剪贴板,粘到 Word 里是矢量,比截图清楚。批量导出用 for 循环,文件名带编号,路径别用中文和空格,D:\Matlab_work\out\ 下面 fig_001.png 这种。
图例数量跟 plot 数量对不上会报错,legend('A','B','C') 三条曲线,plot 了四条,图例只标前三个,第四个没名字。图例位置 'northeast' 默认右上,'best' 让 Matlab 自己找空白,'northoutside' 放图外面,'southoutside' 放底下。多条曲线图例顺序跟 plot 顺序一致,颜色和线型对不上就回去查 plot 的顺序。中文字体乱码,set(gca,'FontName','SimSun') 或者 'SimHei',LaTeX 解释器用 'Interpreter','latex',数学符号 \alpha \beta \theta 直接写。
特殊坐标轴,semilogx、semilogy、loglog、xline(5)、yline(0)、xregion(2,4)、yregion、text(x,y,'标注')、annotation('textarrow',[0.3 0.5],[0.6 0.8],'String','峰值')、rectangle('Position',[x y w h])、fill(x,y,'r')、area(x,y)、stairs(x,y)、stem(x,y)、comet(x,y)、feather、compass、ribbon、waterfall、pcolor、imagesc、spy。三维旋转视角 view(az,el),view(2) 切回二维,daspect([1 1 1]) 等比例,pbaspect。动画用 drawnow、getframe、VideoWriter,帧率 30,存成 mp4。
下次把那个 export_all.m 里的 PDF 分支补上,现在只导出 PNG,ContentType 参数写的是……
免责声明:本文系网络转载或改编,未找到原创作者,版权归原作者所有。如涉及版权,请联系删
 技术文档
技术文档
 推荐好文
推荐好文






 155-2731-8020