


软件

产品


fluentd是一个开源的日志收集系统,能够收集各式各样的日志, 并将日志转换成方便机器处理的json格式。
不同 操作系统 的安装方式不同,具体可以参考:
另外在生产环境中安装Fluentd之前,也需要对操作系统做一些配置,如:
具体配置可以参考:
本文为了便于快速测试,直接使用fluentd的 docker 镜像来启动fluentd服务。
下载fluentd镜像
$ docker pull fluent/fluentd:v1.7-1
首先创建一些简单的文件方便测试。
$ mkdir fluentd_demo
注意: 本文后续所有命令都在fluentd_demo目录下执行
$ cd fluentd_demo
创建用于保存fluentd的配置文件的etc目录和保存日志文件的 log 目录
$ mkdir -p etc log
再创建一个简单的配置文件
$ cat etc/fluentd_basic_setup.conf
<source>
  @type http
  port 8888
  bind 0.0.0.0
</source>
<match test.cycle>
  @type stdout
</match>
配置文件解释:
目前不用太关心配置文件的格式,后面会有详细的介绍。
创建好的目录结构如下:
$ tree
.
├── etc
│   └── fluentd_basic_setup.conf
└── log
$ docker run -p 8888:8888 --rm -v $(pwd)/etc:/fluentd/etc -v $(pwd)/log:/fluentd/log fluent/fluentd:v1.7-1 -c /fluentd/etc/fluentd_basic_setup.conf -v
命令参数解释如下:
fluentd -c /fluentd/etc/fluentd_basic_setup.conf -v
2019-11-27 02:03:22 +0000 [info]: fluent/log.rb:322:info: parsing config file is succeeded path="/fluentd/etc/fluentd_basic_setup.conf"
2019-11-27 02:03:22 +0000 [info]: fluent/log.rb:322:info: using configuration file: <ROOT>
  <source>
    @type http
    port 8888
    bind "0.0.0.0"
  </source>
  <match test.cycle>
    @type stdout
  </match>
</ROOT>
2019-11-27 02:03:22 +0000 [info]: fluent/log.rb:322:info: starting fluentd-1.7.4 pid=6 ruby="2.5.7"
2019-11-27 02:03:22 +0000 [info]: fluent/log.rb:322:info: spawn command to main:  cmdline=["/usr/bin/ruby", "-Eascii-8bit:ascii-8bit", "/usr/bin/fluentd", "-c", "/fluentd/etc/fluentd_basic_setup.conf", "-v", "-p", "/fluentd/plugins", "--under-supervisor"]
2019-11-27 02:03:23 +0000 [info]: fluent/log.rb:322:info: gem 'fluentd' version '1.7.4'
2019-11-27 02:03:23 +0000 [info]: fluent/log.rb:322:info: adding match pattern="test.cycle" type="stdout"
2019-11-27 02:03:23 +0000 [info]: fluent/log.rb:322:info: adding source type="http"
2019-11-27 02:03:23 +0000 [info]: #0 fluent/log.rb:322:info: starting fluentd worker pid=14 ppid=6 worker=0
2019-11-27 02:03:23 +0000 [debug]: #0 fluent/log.rb:302:debug: listening http bind="0.0.0.0" port=8888
2019-11-27 02:03:23 +0000 [info]: #0 fluent/log.rb:322:info: fluentd worker is now running worker=0
另外,也可以通过环境变量FLUENTD_CONF设置需要使用的配置文件
# 下面的命令和上面的是等效的
$ docker run -p 8888:8888 --rm -v $(pwd)/etc:/fluentd/etc/ -e FLUENTD_CONF=fluentd_basic_setup.conf fluent/fluentd:v1.7-1
任意伪造一个用户登录的日志,向fluentd服务提交日志
$ curl -i -X POST -d 'json={"action":"login","user":2}' http://localhost:8888/test.cycle
HTTP/1.1 200 OK
Content-Type: text/plain
Connection: Keep-Alive
Content-Length: 0
在fluentd的容器里能看到如下输出
2019-11-27 02:05:16.583154500 +0000 test.cycle: {"action":"login","user":2}
正如开篇提到过,Fluentd是一个日志收集系统,那么一条日志消息,在Fluentd里就认为是一个事件(Event)。
Fluentd的事件由下面三部分组成
192.168.0.1 - - [28/Feb/2013:12:00:00 +0900] "GET / HTTP/1.1" 200 777
通过in_tail输入插件处理之后,将会得到下面的输出
tag: apache.access # 由配置文件指定
time: 1362020400   # 28/Feb/2013:12:00:00 +0900
record: {"user":"-","method":"GET","code":200,"size":777,"host":"192.168.0.1","path":"/"}
当fluentd收到一个事件之后,会经过一系列的处理流程:
如修改事件的相关字段
过滤掉一些不关心的事件
路由事件输出到不同的地方
下面将一一介绍介绍事件的处理流程
Filter用于定义一个事件是该被接受或者是被过滤掉(抛弃掉)。使用示例如下:
$ cat etc/fluentd_filter_demo.conf
<source>
  @type http
  port 8888
  bind 0.0.0.0
</source>

<filter test.cycle>
  @type grep
  <exclude>
    key action
    pattern ^logout$
  </exclude>
</filter>

<match test.cycle>
  @type stdout
</match>
上面的示例配置了让我们直接过滤掉用户logout的事件。
重启fluentd,使用上面的定义的配置文件
$ docker run -p 8888:8888 --rm -v $(pwd)/etc:/fluentd/etc -v $(pwd)/log:/fluentd/log fluent/fluentd:v1.7-1 -c /fluentd/etc/fluentd_filter_demo.conf -v
测试
$ curl -i -X POST -d 'json={"action":"login","user":2}' http://localhost:8888/test.cycle
HTTP/1.1 200 OK
Content-type: text/plain
Connection: Keep-Alive
Content-length: 0

$ curl -i -X POST -d 'json={"action":"logout","user":2}' http://localhost:8888/test.cycle
HTTP/1.1 200 OK
Content-type: text/plain
Connection: Keep-Alive
Content-length: 0
我们向fluentd发送了两个事件,分别是用户login和logout的事件。
检查fluend的输出
2019-11-27 03:38:28.973757600 +0000 test.cycle: {"action":"login","user":2}
可以看到只输出了用户login的事件,logout事件被过滤掉了。
从前面的例子里,我们可以看到,fluentd的处理流程是根据我们在配置文件中的定义,从上到下依次执行的。假如我们在配置文件里定义了比较多输入源,不同的输入源需要使用不同的filters时,如果仍然按照从上到下执行的顺序的话,由于不同的处理需求,我们的配置文件可能变得非常复杂。
通过label,我们可以为不同的输入源指定不同的处理流程,示例如下:
$ cat etc/fluentd_labels.conf

<source>
  @type http
  bind 0.0.0.0
  port 8888
  @label @STAGING  # 注意这里我们添加了label
</source>

<filter test.cycle>
  @type grep
  <exclude>
    key action
    pattern ^login$
  </exclude>
</filter>

<label @STAGING>
  <filter test.cycle>
    @type grep
    <exclude>
      key action
      pattern ^logout$
    </exclude>
  </filter>

  <match test.cycle>
    @type stdout
  </match>
</label>
上面的示例文件里,我们首先定义了一个filter过滤掉login事件
<filter test.cycle>
  @type grep
  <exclude>
    key action
    pattern ^login$
  </exclude>
</filter>
接着又在label块里面过滤掉了logout事件
<filter test.cycle>
  @type grep
  <exclude>
    key action
    pattern ^login$
  </exclude>
</filter>
如果按照从上到下的顺序执行,那么我们将看不到任何login和logout的事件。但是实际结果如何呢?让我们来测试一下。
使用上面定义的配置文件启动fluentd
$ docker run -p 8888:8888 --rm -v $(pwd)/etc:/fluentd/etc -v $(pwd)/log:/fluentd/log fluent/fluentd:v1.7-1 -c /fluentd/etc/fluentd_labels.conf -v
提交事件来测试, 同样向fluentd发送两个事件,分别是用户login和logout的事件。
$ curl -i -X POST -d 'json={"action":"login","user":2}' http://localhost:8888/test.cycle
HTTP/1.1 200 OK
Content-Type: text/plain
Connection: Keep-Alive
Content-Length: 0

$ curl -i -X POST -d 'json={"action":"logout","user":2}' http://localhost:8888/test.cycle
HTTP/1.1 200 OK
Content-Type: text/plain
Connection: Keep-Alive
Content-Length: 0
查看fluentd输出
2019-11-27 03:51:45.088464900 +0000 test.cycle: {"action":"login","user":2}
可以看到,只有logout事件被过滤了,原因是我们为输入设置了label
<source>
  @type http
  bind 0.0.0.0
  port 8888
  @label @STAGING  # 注意这里我们添加了label
</source>
因此跳过中间设置的一些filter,只运行了<label @STAGING>…标签块里的filter
在前面的例子中,我们使用的都是stdout这样一个没有缓冲区的输出,在生产环境中,我们用到的输出基本都是有缓冲区 的,比如s3, forward,mongodb等,这些输出插件在收到事件之后,会将事件先保存到缓冲区,然后等满足特定条件之后,再将事件输出到目标输出。
配置文件由一下几部分组成
配置文件中的术语
例如:
# 在24224端口接受TCP事件
<source>
  @type forward
  port 24224
</source>

<source>
  @type http
  port 9880
</source>
输入源可以一次指定多个, @ type 参数指定使用哪一个输入插件。 fluentd支持各种输入插件, 比如:
例如:
# 将满足myapp.acccess标签的事件全部输出到
# /var/log/fluent/access.%Y-%m-%d
<match myapp.access>
  @type file
  path /var/log/fluent/access
</match>
输出也可以一次指定多个, @type参数指定使用哪一个输出插件。 fluentd支持各种输出插件, 比如:
可以多个filter串联起来,比如:
Input -> filter 1 -> … -> filter N -> Output
例如:
<filter myapp.access>
@type record_transformer
<record>
  host_param "#{Socket.gethostname}"
</record>
</filter>
上面的filter会添加host_param参数到事件
fluentd也内置了各种filter, 比如:
可以设置的参数有
<system>
# equal to -qq option
log_level error
# equal to --without-source option
without_source
# ...
</system>
例如:
<source>
@type forward
</source>

<source>
  @type tail
  @label @SYSTEM
</source>

<filter access.**>
  @type record_transformer
  <record>
    # ...
  </record>
</filter>
<match **>
  @type elasticsearch
  # ...
</match>

<label @SYSTEM>
  <filter var.log.middleware.**>
    @type grep
    # ...
  </filter>
  <match **>
    @type s3
    # ...
  </match>
</label>
上面的配置文件中:
in_forward的事件将经过record_transformer 过滤器和elasticsearch输出。
in_tail输入的事件将经过grep过滤器和s3输出。
另外: <label @ERROR>属于内置的配置,用于保存内部错误,比如: 缓冲区已经满了或者无效的事件等。
@include: 引入其它的配置文件。可以将配置文件拆分为多个,便于复用。当要使用的时候,直接使用@include引入即可,例如:
# 通过绝对路径引入
@include /path/to/config.conf

# 通过相对路径引入,相对于当前配置文件的路径
@include extra.conf

# 模糊匹配,所有符合条件的会根据文件名的字母顺序依次导入
# 比如: a.conf, b.conf, ..., z.conf
# 因此, 要注意各个配置文件不应该有顺#序依赖,如果有顺序依赖,请明确指出导入的文件名
@include config.d/*.conf

# 使用在线的配置
@include http://example.com/fluent.conf
@include指定也可以用于导入相关的参数信息,比如:
有如下配置文件
<match pattern>
  @type forward
  # other parameters...
  <buffer>
    @type file
    path /path/to/buffer/forward
    @include /path/to/out_buf_params.conf
  </buffer>
</match>

<match pattern>
  @type elasticsearch
  # other parameters...
  <buffer>
    @type file
    path /path/to/buffer/es
    @include /path/to/out_buf_params.conf
  </buffer>
</match>
参数配置文件/path/to/out_buf_params.conf
flush_interval 5s
total_limit_size 100m
chunk_limit_size 1m
如前面的示例可以看到,fluented主要根据事件的tag来分区不同的处理流程
虽然我们可以明确指定需要处理的tag,比如:
tag通常是一个字符串,由.分隔,比如myapp.access
这种格式也可以和通配符组合使用,比如a.{b.c}.或a.{b.c}.*
<match "app.#{ENV['FLUENTD_TAG']}">
  @type stdout
</match>
如果设置了环境变量FLUENTD_TAG为dev,那上面等价于app.dev
当有多个match, 需要注意一下它们的顺序, 如下面的例子,第二个match永远也不会生效
# ** matches all tags. Bad :(
<match **>
  @type blackhole_plugin
</match>

<match myapp.access>
  @type file
  path /var/log/fluent/access
</match>
正确的写发应该是将确定的tag尽量写在前面,模糊匹配的写在后面。
<match myapp.access>
  @type file
  path /var/log/fluent/access
</match>


# Capture all unmatched tags. Good :)
<match **>
  @type blackhole_plugin
</match>
如果需要将输出到多个match,需要使用out_copy插件。
另外需要注意顺序的是filter和match, 如果将filter放在match之后,那么它也永远不会生效,正确的用法如下:
# You should NOT put this <filter> block after the <match> block below.
# If you do, Fluentd will just emit events without applying the filter.
<filter myapp.access>
  @type record_transformer
  ...
</filter>

<match myapp.access>
  @type file
  path /var/log/fluent/access
</match>
下面给出了一些常见的使用场景的配置文件写法
<source>
  @type forward
</source>

<filter app.**>
  @type record_transformer
  <record>
    hostname "#{Socket.gethostname}"
  </record>
</filter>

<match app.**>
  @type file
  # ...
</match>
<source>
  @type forward
</source>

<source>
  @type tail
  tag system.logs
  # ...
</source>

<filter app.**>
  @type record_transformer
  <record>
    hostname "#{Socket.gethostname}"
  </record>
</filter>

<match {app.**,system.logs}>
  @type file
  # ...
</match>
<source>
@type forward
</source>

<source>
  @type dstat
  @label @METRICS # dstat events are routed to <label @METRICS>
  # ...
</source>

<filter app.**>
  @type record_transformer
  <record>
    # ...
  </record>
</filter>

<match app.**>
  @type file
  # ...
</match>

<label @METRICS>
  <match **>
    @type elasticsearch
    # ...
  </match>
</label>
<match worker.**>
  @type route
  remove_tag_prefix worker
  add_tag_prefix metrics.event

  <route **>
    copy # For fall-through. Without copy, routing is stopped here.
  </route>
  <route **>
    copy
    @label @BACKUP
  </route>
</match>

<match metrics.event.**>
  @type stdout
</match>

<label @BACKUP>
  <match metrics.event.**>
    @type file
    path /var/log/fluent/bakcup
  </match>
</label>
<source>
  @type forward
</source>

# event example: app.logs {"message":"[info]: ..."}
<match app.**>
  @type rewrite_tag_filter
  <rule>
    key message
    pattern ^\[(\w+)\]
    tag $1.${tag}
  </rule>
  # you can put more <rule>
</match>

# send mail when receives alert level logs
<match alert.app.**>
  @type mail
  # ...
</match>

# other logs are stored into file
<match *.app.**>
  @type file
  # ...
</match>
<source>
  @type forward
</source>

<match app.**>
  @type copy
  <store>
    @type forward
    # ...
  </store>
  <store>
    @type relabel
    @label @NOTIFICATION
  </store>
</match>

<label @NOTIFICATION>
  <filter app.**>
    @type grep
    regexp1 message ERROR
  </filter>

  <match app.**>
    @type mail
  </match>
</label>
在配置文件中使用的插件,大部分都可以接受1个或多个参数,也可以指定参数类型
以@开始的参数表示fluented的保留参数
下面的模块并不是所有的插件都支持,具体使用请结合使用的插件查看
可以使用下面的命令检查配置文件的格式是否正确
$ docker run --rm -v $(pwd)/etc:/fluentd/etc/ fluent/fluentd:v1.7-1 --dry-run -c /fluentd/etc/fluentd_basic_setup.conf
在使用fluentd收集docker日志时,默认会将日志分成4个部分:
分别是:
首先创建一个配置文件etc/fluentd_docker.conf
<source>
  @type forward
  port 24224
  bind 0.0.0.0
</source>
<match **>
    @type stdout
</match>


# 启动一个fluentd服务
$ docker run -it -p 24224:24224 -v $(pwd)/etc:/fluentd/etc/ -e FLUENTD_CONF=fluentd_docker.conf fluent/fluentd:v1.7-1

# 启动一个docker容器并使用fluentd收集日志
$ docker run --log-driver=fluentd -p 5000:80 httpd

# 访问服务产生日志
$ curl http://127.0.0.1:5000
<html><body><h1>It works!</h1></body></html>
在fluentd的容器日志里,能看到下面的输出
2019-11-28 01:43:23.000000000 +0000 8da5b8365552: {"container_id":"8da5b8365552b4c0c610ff5df3dc28509bfc5781ec580628143b00cf997d5b72","container_name":"/confident_curie","source":"stdout","log":"172.17.0.1 - - [28/Nov/2019:01:43:23 +0000] \"GET / HTTP/1.1\" 200 45"}
为了介绍下对日志常用的处理场景,这里将收集的日志分成三部分:
首先,根据我们上面的需求,创建fluentd配置文件
$ cat etc/fluentd_docker_compose.conf

<source>
    @type forward
    port 24224
    bind 0.0.0.0
</source>

# docker相关的日志处理
<match docker.**>
    # docker相关的日志输出三份,一份输出到fluentd容器的标准输出,便于实时查看,另一份保存到文件, 还有一份保存到Elasticsearch
    @type copy

    # 输出到标准输出
    <store>
        @type stdout
        # 默认输出的格式是json格式,由于docker生成的日志,包含了容器信息等其他信息,不是很方便人去阅读。
        # 这里只输出我们关心的log字段
        # 使用stdout作为主format,single_value为子format,这样可以在输出log的同时保留直接tag和time信息
        <format>
           @type stdout
           output_type single_value
           message_key log
           add_newline true
        </format>
    </store>

    # 输出到文件
    <store>
        @type file
        # 使用tag和日期作为保存日志的文件名
        path /fluentd/log/${tag}/%Y%m%d
        # 合并多个flush chunk块到一个文件
        append true
        # 使用gzip压缩生成的日志文件
        compress gzip
        <format>
            @type stdout
            output_type single_value
            message_key log
            add_newline true
        </format>
        # 使用文件作为缓冲区
        <buffer tag, time>
            @type file
            chunk_limit_size 1M
            # 每隔1分钟写一次日志
            flush_interval 1m
            flush_at_shutdown true
            flush_mode interval
        </buffer>
    </store>

    # 输出到Eleastichsearch
    <store>
       @type elasticsearch
       host elasticsearch
       port 9200
       logstash_format true
       logstash_prefix fluentd
       logstash_dateformat %Y%m%d
       include_tag_key true
       type_name access_log
       tag_key @log_name
    </store>
</match>

# 其它日志处理
<match **>
    @type copy

    <store>
        @type stdout
    </store>

    # 输出到others目录
    <store>
        @type file
        path /fluentd/log/others/${tag}/%Y%m%d
        append true
        <buffer tag, time>
            @type file
            chunk_limit_size 1M
            flush_interval 1m
            flush_at_shutdown true
            flush_mode interval
        </buffer>
    </store>
</match>
由于使用到了elasticsearch输出插件,而默认的fluentd中并没有安装这个插件,因此,我们需要自己定义Dockfile来安装elasticsearch插件
$ cat fluentd/Dockerfile
FROM fluent/fluentd:v1.7-1
USER root
RUN ["fluent-gem", "install", "fluent-plugin-elasticsearch"]
USER fluent
最后创建docker-compose.yaml文件
$ cat docker-compose.yaml

version: '3'
services:
  httpd:
    image: httpd
    ports:
      - "5000:80"
    networks:
      - webnet
    depends_on:
      - fluentd
    logging:
      driver: fluentd
      options:
        fluentd-address: "localhost:24224"
        fluentd-retry-wait: '1s'
        fluentd-max-retries: '10'
        tag: docker.httpd

  fluentd:
    build: ./fluentd/
    volumes:
      - ./etc/:/fluentd/etc
      - ./log/:/fluentd/log
    ports:
      - "24224:24224"
      - "24224:24224/udp"
    environment:
      - FLUENTD_CONF=fluentd_docker_compose.conf
    networks:
      - webnet
    depends_on:
      - elasticsearch
      - kibana

  elasticsearch:
    image: docker.elastic.co/elasticsearch/elasticsearch-oss:6.2.3
    ports:
      - "9200:9200"
    networks:
      - webnet
    ports:
      - "9200:9200"
      - "9300:9300"
    environment:
      - discovery.type=single-node
      - cluster.name=docker-cluster
      - bootstrap.memory_lock=true
      - http.host=0.0.0.0
      - transport.host=127.0.0.1
      - "ES_JAVA_OPTS=-Xms512m -Xmx512m"
    ulimits:
      memlock:
        soft: -1
        hard: -1
    volumes:
      - es_data:/usr/share/elasticsearch/data

  kibana:
    image: docker.elastic.co/kibana/kibana-oss:6.2.3
    environment:
      SERVER_NAME: kibana-server
      ELASTICSEARCH_URL: http://elasticsearch:9200
    ports:
      - "5601:5601"
    depends_on:
      - elasticsearch
    networks:
      - webnet

networks:
  webnet:

volumes:
  es_data:
    driver: local
最后启动服务
$ docker-compose up --build
实际使用中发现,采用上面的方式启动服务后,有时间fluentd没法收集到httpd服务的日志,最后发现原因是如果在fluentd服务还没准备就绪的情况下就启动httpd服务,就会产生这种现象。因此,建议的做法是先启动fluentd, 再启动httpd
$ docker-compose up --build fluentd

# 等fluentd服务就绪后,再启动httpd服务
$ docker-compose up httpd
当然更优雅点的做法是控制docker-compose中服务的启动顺序,具体可以参考:
== https://docs.docker.com/compose/startup-order/==
测试,访问 httpd服务
# 可以多执行几次,产生多一些访问记录
$ curl http://127.0.0.1/5000
最后可以分别在fluentd的容器的终端,log目录,以及elasticsearch中看到保存的访问记录信息了。如下是通过Kibana面板看到的请求情况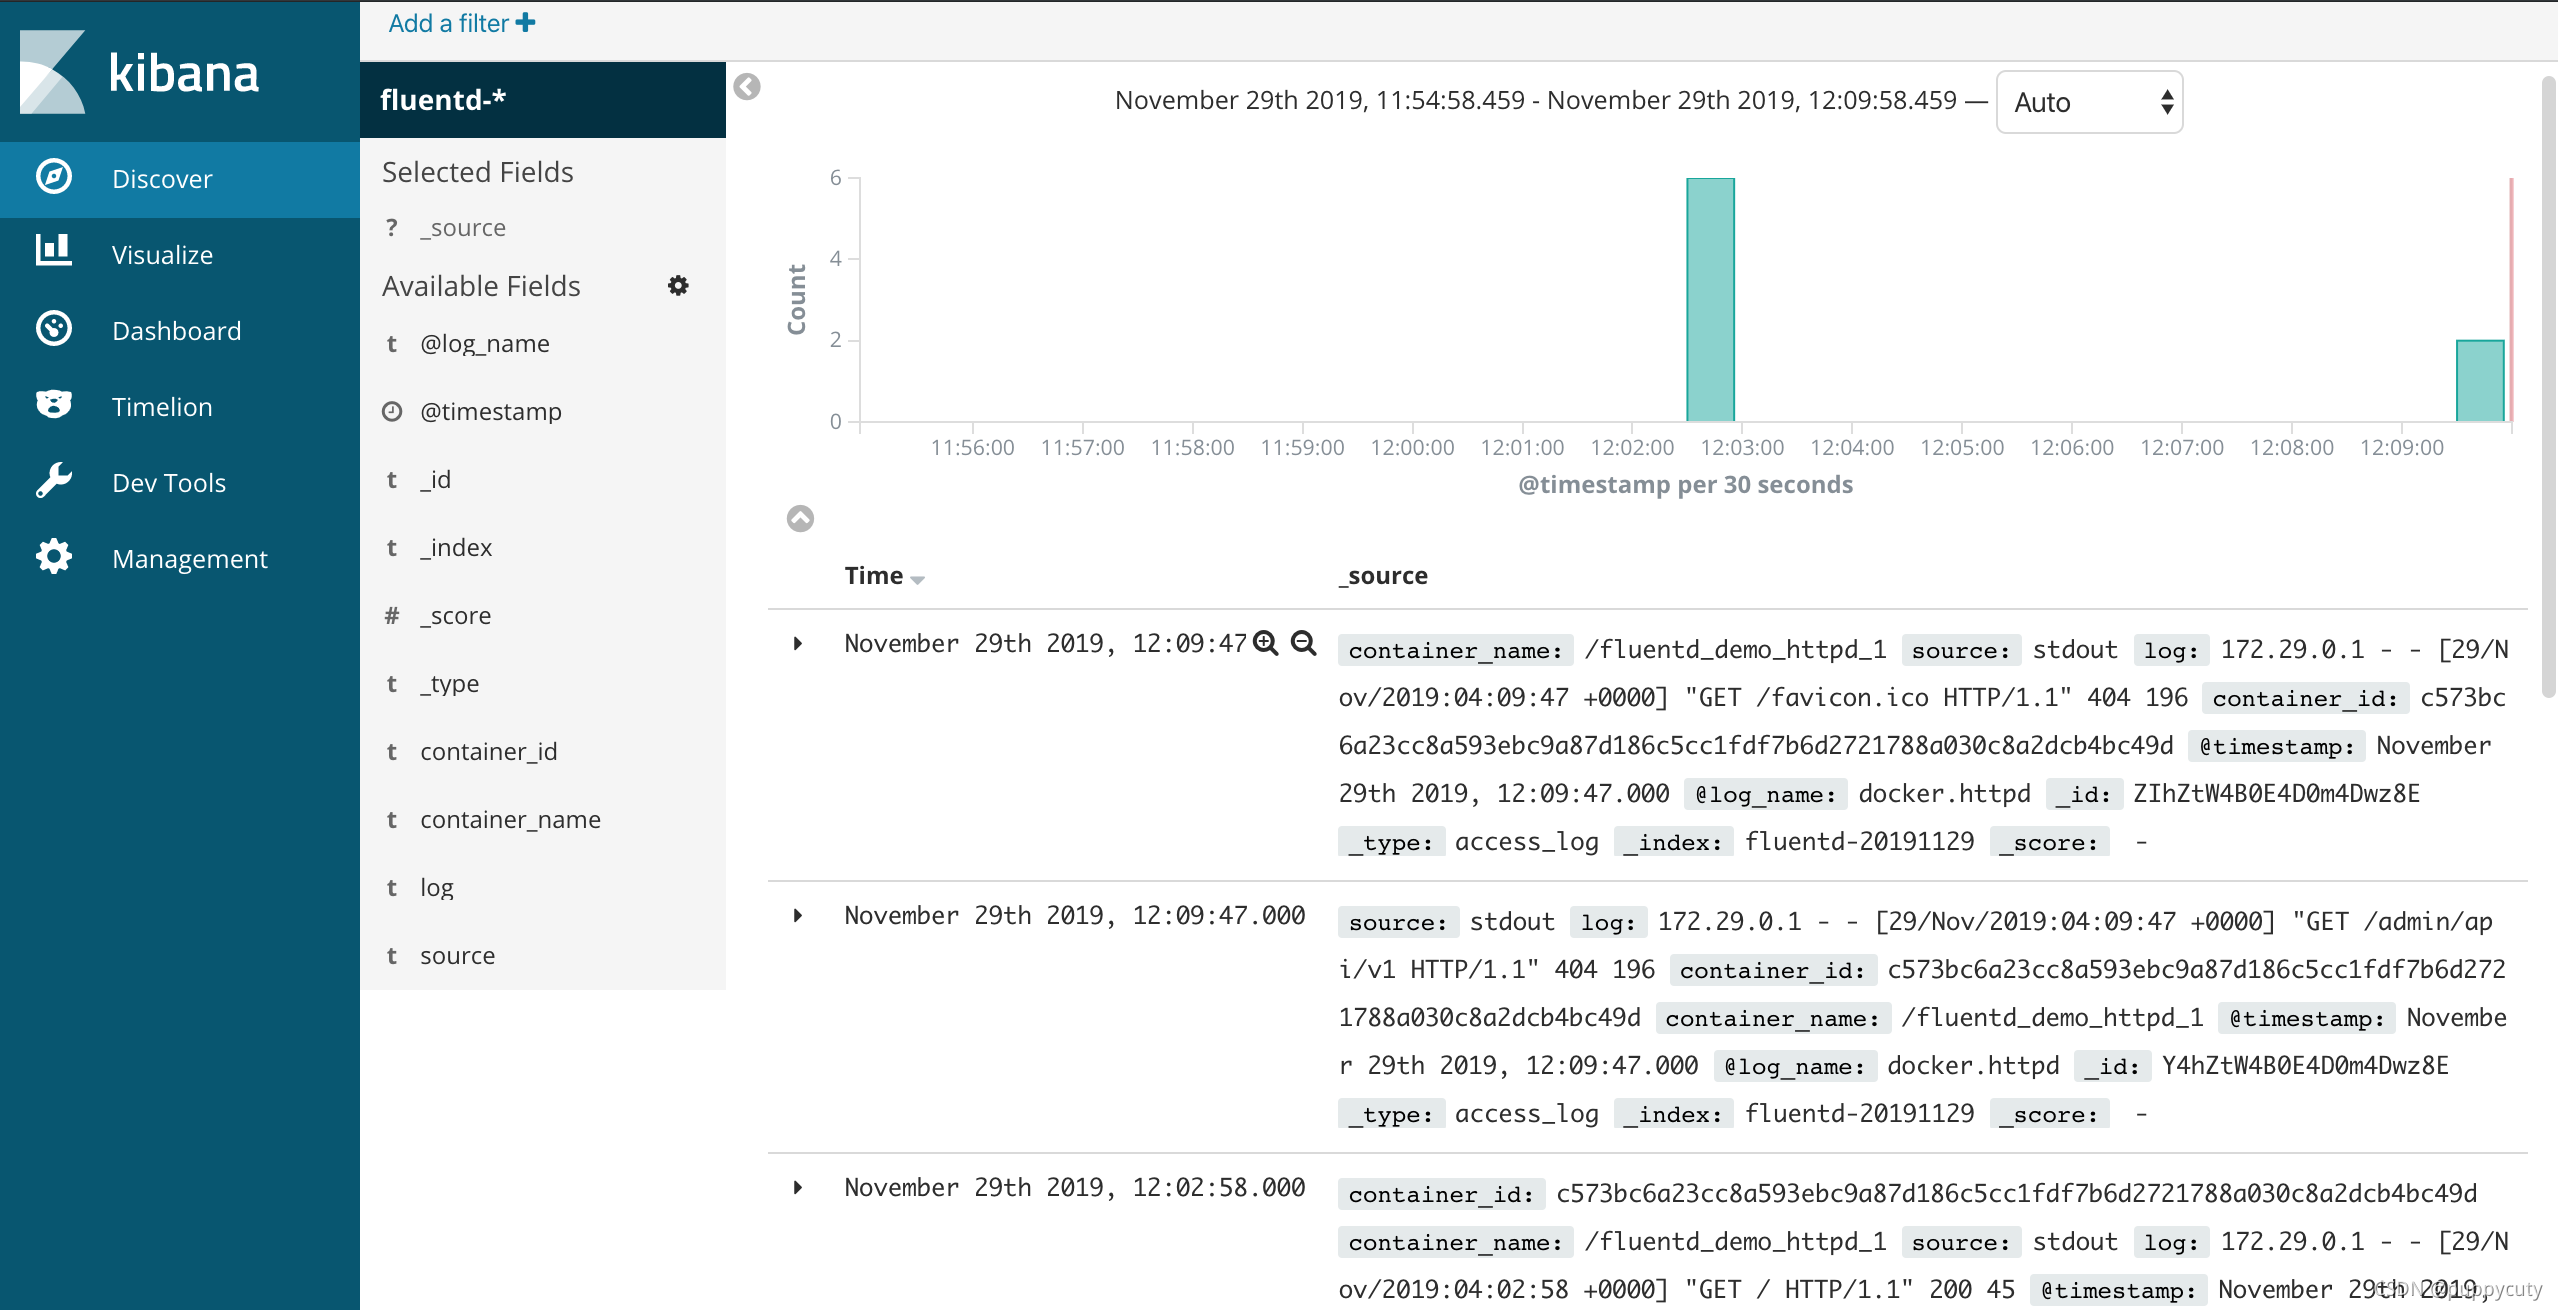
更多关于Fluentd的使用方式可以参考官方文档
免责声明:本文系网络转载或改编,未找到原创作者,版权归原作者所有。如涉及版权,请联系删
 技术文档
技术文档
 推荐好文
推荐好文


 155-2731-8020


