


软件

产品


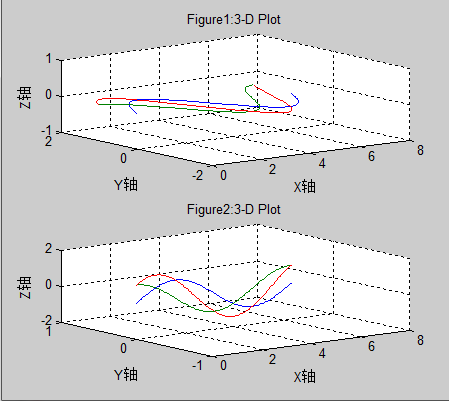
1. 三维曲线图:
h0=figure('toolbar','none',...
'position',[200 150 450 400],...
'name','实例19');
subplot(2,1,1)
x=linspace(0,2*pi);
y1=sin(x);
y2=cos(x);
y3=sin(x)+cos(x);
z1=zeros(size(x));
z2=0.5*z1;
z3=z1;
plot3(x,y1,z1,x,y2,z2,x,y3,z3)
grid on
xlabel('X轴');
ylabel('Y轴');
zlabel('Z轴');
title('Figure1:3-D Plot')
subplot(2,1,2)
x=linspace(0,2*pi);
y1=sin(x);
y2=cos(x);
y3=sin(x)+cos(x);
z1=zeros(size(x));
z2=0.5*z1;
z3=z1;
plot3(x,z1,y1,x,z2,y2,x,z3,y3)
grid on
xlabel('X轴');
ylabel('Y轴');
zlabel('Z轴');
title('Figure2:3-D Plot')
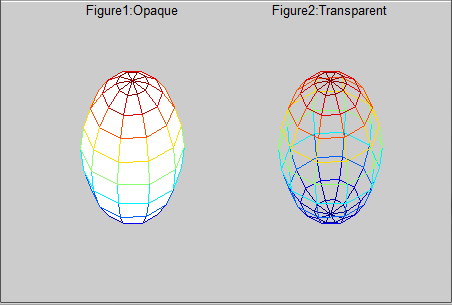
2. 图形的隐藏属性:
h0=figure('toolbar','none',...
'position',[200 150 450 300],...
'name','实例20');
subplot(1,2,1)
[x,y,z]=sphere(10);
mesh(x,y,z)
axis off
title('Figure1:Opaque')
hidden on
subplot(1,2,2)
[x,y,z]=sphere(10);
mesh(x,y,z)
axis off
title('Figure2:Transparent')
hidden off
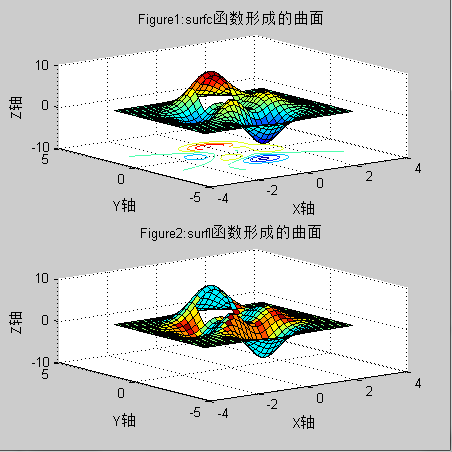
3. PEAKS函数曲线:
h0=figure('toolbar','none',...
'position',[200 100 450 450],...
'name','实例21');
[x,y,z]=peaks(30);
subplot(2,1,1)
x=x(1,:);
y=y(:,1);
i=find(y>0.8&y<1.2);
j=find(x>-0.6&x<0.5);
z(i,j)=nan*z(i,j);
surfc(x,y,z)
xlabel('X轴');
ylabel('Y轴');
zlabel('Z轴');
title('Figure1:surfc函数形成的曲面')
subplot(2,1,2)
x=x(1,:);
y=y(:,1);
i=find(y>0.8&y<1.2);
j=find(x>-0.6&x<0.5);
z(i,j)=nan*z(i,j);
surfl(x,y,z)
xlabel('X轴');
ylabel('Y轴');
zlabel('Z轴');
title('Figure2:surfl函数形成的曲面')
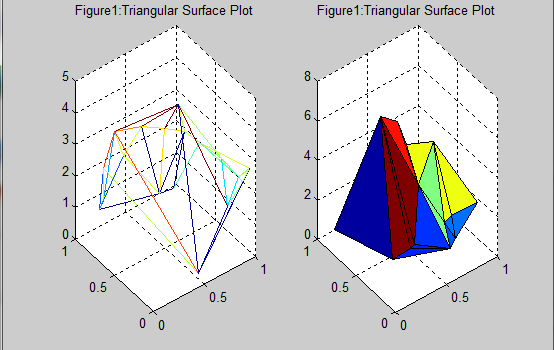
4. 片状图:
h0=figure('toolbar','none',...
'position',[200 150 550 350],...
'name','实例22');
subplot(1,2,1)
x=rand(1,20);
y=rand(1,20);
z=peaks(x,y*pi);
t=delaunay(x,y);
trimesh(t,x,y,z)
hidden off
title('Figure1:Triangular Surface Plot');
subplot(1,2,2)
x=rand(1,20);
y=rand(1,20);
z=peaks(x,y*pi);
t=delaunay(x,y);
trisurf(t,x,y,z)
title('Figure1:Triangular Surface Plot');
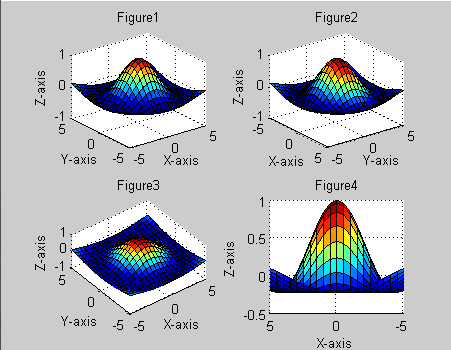
5. 视角的调整:
h0=figure('toolbar','none',...
'position',[200 150 450 350],...
'name','实例23');
x=-5:0.5:5;
[x,y]=meshgrid(x);
r=sqrt(x.^2+y.^2)+eps;
z=sin(r)./r;
subplot(2,2,1)
surf(x,y,z)
xlabel('X-axis')
ylabel('Y-axis')
zlabel('Z-axis')
title('Figure1')
view(-37.5,30)
subplot(2,2,2)
surf(x,y,z)
xlabel('X-axis')
ylabel('Y-axis')
zlabel('Z-axis')
title('Figure2')
view(-37.5+90,30)
subplot(2,2,3)
surf(x,y,z)
xlabel('X-axis')
ylabel('Y-axis')
zlabel('Z-axis')
title('Figure3')
view(-37.5,60)
subplot(2,2,4)
surf(x,y,z)
xlabel('X-axis')
ylabel('Y-axis')
zlabel('Z-axis')
title('Figure4')
view(180,0)
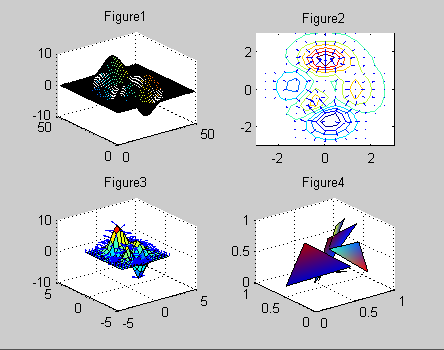
6. 向量场的绘制:
h0=figure('toolbar','none',...
'position',[200 150 450 350],...
'name','实例24');
subplot(2,2,1)
z=peaks;
ribbon(z)
title('Figure1')
subplot(2,2,2)
[x,y,z]=peaks(15);
[dx,dy]=gradient(z,0.5,0.5);
contour(x,y,z,10)
hold on
quiver(x,y,dx,dy)
hold off
title('Figure2')
subplot(2,2,3)
[x,y,z]=peaks(15);
[nx,ny,nz]=surfnorm(x,y,z);
surf(x,y,z)
hold on
quiver3(x,y,z,nx,ny,nz)
hold off
title('Figure3')
subplot(2,2,4)
x=rand(3,5);
y=rand(3,5);
z=rand(3,5);
c=rand(3,5);
fill3(x,y,z,c)
grid on
title('Figure4')
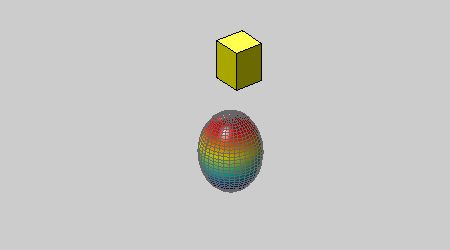
6. 灯光定位:
h0=figure('toolbar','none',...
'position',[200 150 450 250],...
'name','实例25');
vert=[1 1 1;1 2 1;
2 2 1;2 1 1;
1 1 2;1 2 2;
2 2 2;2 1 2];
fac=[1 2 3 4;2 6 7 3;
4 3 7 8;1 5 8 4;
1 2 6 5;5 6 7 8];
grid off
sphere(36)
h=findobj('type','surface');
set(h,'facelighting','phong',...
'facecolor',...
'interp',...
'edgecolor',[0.4 0.4 0.4],...
'backfacelighting',...
'lit')
hold on
patch('faces',fac,'vertices',vert,...
'facecolor','y');
light('position',[1 3 2]);
light('position',[-3 -1 3]);
material shiny
axis vis3d off
hold off
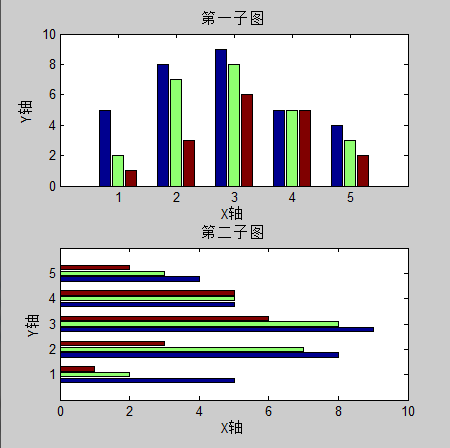
7. 柱状图:
h0=figure('toolbar','none',...
'position',[200 50 450 450],...
'name','实例26');
subplot(2,1,1)
x=[5 2 1
8 7 3
9 8 6
5 5 5
4 3 2];
bar(x)
xlabel('X轴');
ylabel('Y轴');
title('第一子图');
subplot(2,1,2)
y=[5 2 1
8 7 3
9 8 6
5 5 5
4 3 2];
barh(y)
xlabel('X轴');
ylabel('Y轴');
title('第二子图');
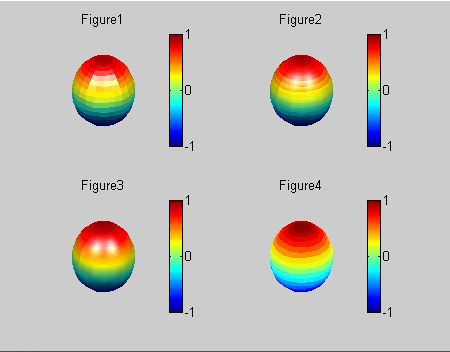
8. 设置照明方式:
h0=figure('toolbar','none',...
'position',[200 150 450 350],...
'name','实例27');
subplot(2,2,1)
sphere
shading flat
camlight left
camlight right
lighting flat
colorbar
axis off
title('Figure1')
subplot(2,2,2)
sphere
shading flat
camlight left
camlight right
lighting gouraud
colorbar
axis off
title('Figure2')
subplot(2,2,3)
sphere
shading interp
camlight right
camlight left
lighting phong
colorbar
axis off
title('Figure3')
subplot(2,2,4)
sphere
shading flat
camlight left
camlight right
lighting none
colorbar
axis off
title('Figure4')
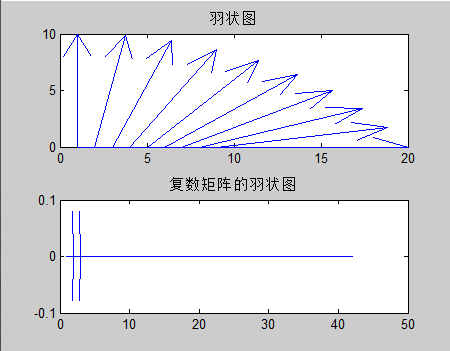
9. 羽状图:
h0=figure('toolbar','none',...
'position',[200 150 450 350],...
'name','实例28');
subplot(2,1,1)
alpha=90:-10:0;
r=ones(size(alpha));
m=alpha*pi/180;
n=r*10;
[u,v]=pol2cart(m,n);
feather(u,v)
title('羽状图')
axis([0 20 0 10])
subplot(2,1,2)
t=0:0.5:10;
x=0.05+i;
y=exp(-x*t);
feather(y)
title('复数矩阵的羽状图')
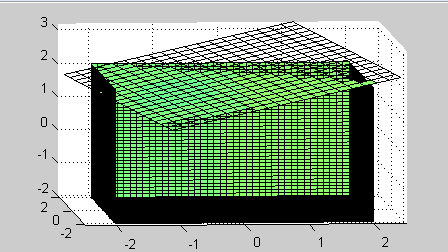
10. 立体透视1:
h0=figure('toolbar','none',...
'position',[200 150 450 250],...
'name','实例29');
[x,y,z]=meshgrid(-2:0.1:2,...
-2:0.1:2,...
-2:0.1:2);
v=x.*exp(-x.^2-y.^2-z.^2);
grid on
for i=-2:0.5:2;
h1=surf(linspace(-2,2,20),...
linspace(-2,2,20),...
zeros(20)+i);
rotate(h1,[1 -1 1],30)
dx=get(h1,'xdata');
dy=get(h1,'ydata');
dz=get(h1,'zdata');
delete(h1)
slice(x,y,z,v,[-2 2],2,-2)
hold on
slice(x,y,z,v,dx,dy,dz)
hold off
axis tight
view(-5,10)
drawnow
end
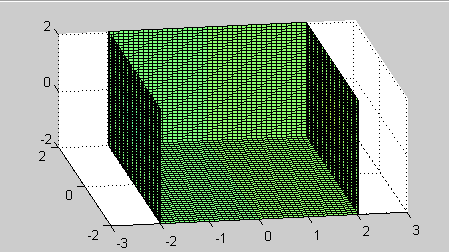
11. 立体透视2:
h0=figure('toolbar','none',...
'position',[200 150 450 250],...
'name','实例30');
[x,y,z]=meshgrid(-2:0.1:2,...
-2:0.1:2,...
-2:0.1:2);
v=x.*exp(-x.^2-y.^2-z.^2);
[dx,dy,dz]=cylinder;
slice(x,y,z,v,[-2 2],2,-2)
for i=-2:0.2:2
h=surface(dx+i,dy,dz);
rotate(h,[1 0 0],90)
xp=get(h,'xdata');
yp=get(h,'ydata');
zp=get(h,'zdata');
delete(h)
hold on
hs=slice(x,y,z,v,xp,yp,zp);
axis tight
xlim([-3 3])
view(-10,35)
drawnow
delete(hs)
hold off
end
免责声明:本文系网络转载或改编,未找到原创作者,版权归原作者所有。如涉及版权,请联系删
 技术文档
技术文档
 推荐好文
推荐好文


 155-2731-8020


