


软件

产品


For the uninitiated the concept of projections and their use in GIS can be a confusing subject area, especially when raster and vector data types fail to align. Projections are simply mathematical transformations that enable representation of 3D coordinate systems into 2D coordinate systems.
对于刚起步的人来说,投影的概念及其在GIS中的使用可能是一个令人困惑的主题领域,尤其是当栅格和矢量数据类型无法对齐时。 投影只是简单的数学转换,可以将3D坐标系表示为2D坐标系。
In relation to GIS and mapping this takes data managed in latitude and longitude and converts it to a more usable resource, such as a flat map which aims to accurately represent shape and area. Essentially the degrees based system of measurement is commonly migrated to a metric system such as metres. This enables you to effectively navigate terrain, or in the case of GIS, enable you to align raster and vector data or capture point, line and polygon features.
对于GIS和制图,这需要采用经度和纬度管理的数据,并将其转换为更有用的资源,例如旨在精确表示形状和区域的平面地图。 本质上,基于学位的测量系统通常会迁移到米制等公制系统。 这使您可以有效地导航地形,或者在GIS的情况下,可以使栅格和矢量数据对齐或捕获点,线和面要素。
The Lamberts Conformal Conic (LCC) projection system was developed in the 18th century by a swiss mathematician named Johann Heinrich Lambert. The formulas behind the transformation would be interesting to some, but is not the primary focus of this article. What is important here is how we can implement this projection to improve spatial data management productivity.
Lamberts Conformal Conic(LCC)投影系统是由瑞士数学家Johann Heinrich Lambert于18世纪开发的。 对于某些人而言,转换背后的公式可能会很有趣,但这不是本文的重点。 这里重要的是我们如何实现此预测以提高空间数据管理的生产率。
Often data is managed based on projected Universal Transverse Mercator (UTM) zones defined by the WGS84 (World Geographic Spheroid) datum. The datum itself is merely a set of values that are used to define a specific geodetic system, and is the same datum that GPS satellites use. In Australia, our datum is the Geocentric Datum of Australia (GDA94) , which is a localised version, that was defined in 1994. It has been closely aligned with WGS84 that enables capture of spatial data direct from satellites without the need to perform complex geospatial transformations.
通常,数据是根据WGS84( 世界地理椭球 )基准所定义的预计通用横向墨卡托(UTM)区域进行管理的。 基准本身只是一组用于定义特定大地测量系统的值,并且与GPS卫星使用的基准相同。 在澳大利亚,我们的基准是澳大利亚的地心基准 (GDA94),它是于1994年定义的本地化版本。它已与WGS84紧密结合,可直接从卫星捕获空间数据,而无需执行复杂的地理空间转变。
The zone system used is similar to UTM and is based on 60 zones of 6 degrees each. These zones are referred to as the Map Grid of Australia. The zones that start at 49 in the west and finish at 57 in the east if you include Lord Howe Island.
所使用的区域系统类似于UTM,并且基于60个区域,每个区域6度。 这些区域被称为澳大利亚地图网格。 如果包括豪勋爵岛,则这些区域从西侧49开始,在东侧57结束。
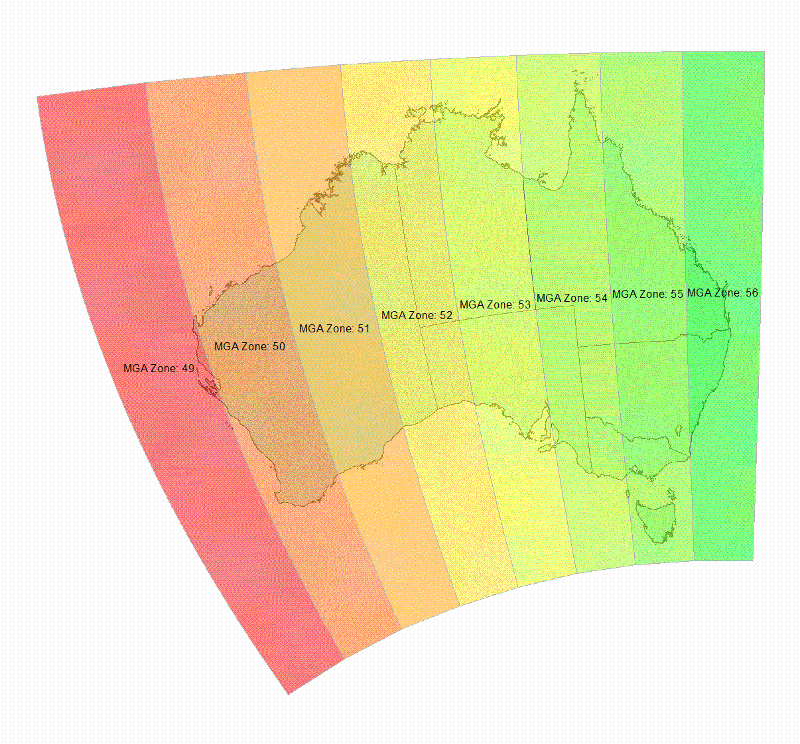
For example if you were to calculate the area of a lake that is divided by a zone, you generally need to do it using two or more processes. This is because once you breach the extent of the zone, where distortion increases significantly and and differences in area or length calculations begin to occur. The distortion will increase the overall perimeter or area of line or polygon calculations the further you travel from the zone extent. If the data are to be used for subsequent geoprocessing tasks all products will inherit the error. This type of error looks more significant if you present it across all zones as shown in the image below.
例如,如果要计算被区域划分的湖泊面积,则通常需要使用两个或多个过程来完成。 这是因为一旦突破该区域的范围,该区域的失真就会显着增加,并且开始会出现面积或长度计算的差异。 距区域范围越远,变形将增加线或面计算的总体周长或面积。 如果将数据用于后续的地理处理任务,则所有产品都将继承该错误。 如果您在所有区域中都显示此错误,则该错误类型看起来更加重要,如下图所示。
ESRI ArcGIS maintains details of the more than 4000 projections managed by the OGP (International Association of Oil and Gas Producers), formerly known as the European Petroleum Survey Group (EPSG) that was founded in 1986. The critical component of this resource is the underlying datum, upon which all coordinate calculations are based. In ArcGIS the projection file (*.prj) is used to maintain this information. This information is used by ArcGIS and other spatial applications to make decisions about where to put your data. The ArcMap application "projects on the fly" when the projection is defined, enabling alignment of raster and vector data with minimal user interaction. The benefits are less confusion and increased productivity. A sample Lamberts projection file (*.prj) is displayed below;
ESRI ArcGIS维护着由OGP(国际石油和天然气生产商协会)管理的4000多个投影的详细信息,OGP的前身是成立于1986年的欧洲石油测量集团(EPSG)。该资源的关键组成部分是基础基准,所有坐标计算都基于该基准。 在ArcGIS中,投影文件(* .prj)用于维护此信息。 ArcGIS和其他空间应用程序使用此信息来决定将数据放置在何处。 定义投影后,ArcMap应用程序将“即时进行投影”,从而使栅格和矢量数据的对齐方式与用户的交互最少。 好处是减少了混乱并提高了生产率。 下面显示一个样本Lamberts 投影文件 (* .prj);
PROJCS["GDA_1994_Geoscience_Australia_Lambert",GEOGCS["GCS_GDA_1994",DATUM["D_GDA_1994",SPHEROID["GRS_1980",6378137.0,298.257222101]],PRIMEM["Greenwich",0.0],UNIT["Degree",0.0174532925199433]],PROJECTION["Lambert_Conformal_Conic"],PARAMETER["False_Easting",0.0],PARAMETER["False_Northing",0.0],PARAMETER["Central_Meridian",134.0],PARAMETER["Standard_Parallel_1",-18.0],PARAMETER["Standard_Parallel_2",-36.0],PARAMETER["Latitude_Of_Origin",0.0],UNIT["Meter",1.0],AUTHORITY["EPSG",3112]]When you create spatial data in ArcGIS you generally have the option to create shapefiles or feature classes. Feature classes are the infrastructure ESRI use to store point, line, polygon or annotation features. Feature classes are stored in ESRI "Geodatabases" that have improved support for spatial data management, including organisation and topological management (basic rules that define how your data is managed for quality assurance).
在ArcGIS中创建空间数据时,通常可以选择创建shapefile或要素类。 要素类是ESRI用于存储点,线,面或注释要素的基础结构。 要素类存储在ESRI“ 地理数据库 ”中,该要素类对空间数据管理(包括组织和拓扑管理)(定义了如何管理数据以确保质量的基本规则)进行了改进的支持。
The Geodatabase "Feature Dataset" may be used to store feature classes of similar spatial extent or type, and automatically have their projection defined when they are created. This reduces the downtime associated with future feature class creation. In simple, all new spatial features will use the same projection, and as an added bonus may also be edited concurrently with other layers in the same feature dataset.
地理数据库“ 要素数据集 ”可用于存储空间范围或类型相似的要素类,并在创建时自动定义其投影。 这样可以减少与将来创建要素类相关的停机时间。 简单来说,所有新的空间要素都将使用相同的投影,并且作为附加功能,还可以与同一要素数据集中的其他图层同时进行编辑。
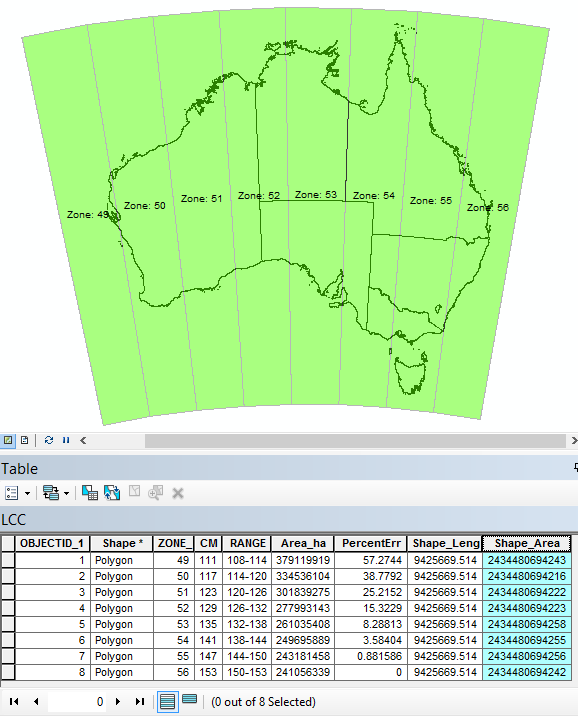
The image below displays the resultant dynamic field calculations when data is managed using the Lamberts projection system. The minor differences present in the attribute table "Shape_" columns are insignificant at this scale. In contrast the "PercentErr" field relates to the "Area_ha" calculation field showing a departure from the calculated coordinate geometry value in Row 8. The "Area_ha" field was calculated manually using an ArcMap dataframe projected in MGA Zone 56.
下图显示了使用Lamberts投影系统管理数据时产生的动态场计算结果。 在此规模上,属性表“ Shape_”列中存在的细微差别并不明显。 相反,“ PercentErr”字段与“ Area_ha”计算字段相关,该字段显示与第8行中计算的坐标几何值的偏差。“ Area_ha”字段是使用在MGA区域56中投影的ArcMap数据框手动计算的。
翻译自: https://www.experts-exchange.com/articles/12326/Improving-Productivity-using-the-Lamberts-Conformal-Conic-Projection-for-Spatial-Data-Management-in-ESRI-ArcGIS.html
 技术文档
技术文档
 推荐好文
推荐好文


 155-2731-8020


