


软件

产品


# author: suoxd123@126.comimport tensorflow as tf# 读取数据mnist = tf.keras.datasets
.mnist(imgTrain, labelTrain),(imgTest, labelTest) = mnist.load_data(path='mnist.npz')1.2.3.4.5.6.
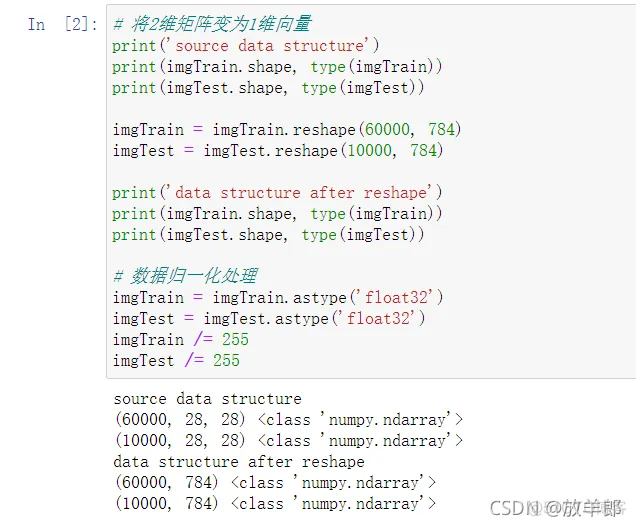
# author: suoxd123@126.com# 将2维矩阵变为1维向量print('source data structure')print
(imgTrain.shape, type(imgTrain))print(imgTest.shape, type(imgTest))imgTrain = imgTrain
.reshape(60000, 784)imgTest = imgTest.reshape(10000, 784)print('data structure after reshape')
print(imgTrain.shape, type(imgTrain))print(imgTest.shape, type(imgTest))
# 数据归一化处理imgTrain = imgTrain.astype('float32')imgTest = imgTest.astype('float32')imgTrain
/= 255imgTest /= 2551.2.3.4.5.6.7.8.9.10.11.12.13.14.15.16.17.18.
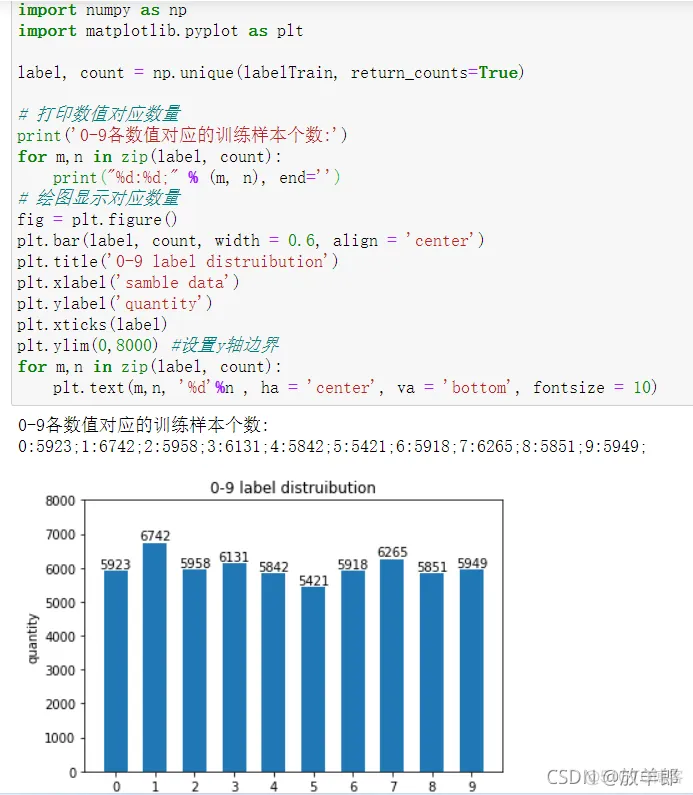
# author: suoxd123@126.com# 统计当前实际数据import numpy as npimport matplotlib.pyplot as pltlabel,
count = np.unique(labelTrain, return_counts=True)
# 打印数值对应数量print('0-9各数值对应的训练样本个数:')for m,n in zip(label, count):
print("%d:%d;" % (m, n), end='')# 绘图显示对应数量fig = plt.figure()plt.bar(label, count,
width = 0.6, align = 'center')plt.title('0-9 label distruibution')plt.xlabel('samble data')plt
.ylabel('quantity')plt.xticks(label)plt.ylim(0,8000) #设置y轴边界for m,n in zip(label, count):plt
.text(m,n, '%d'%n , ha = 'center', va = 'bottom', fontsize = 10)1.2.3.4.5.6.7.8.9.10.11.12.13.14.
15.16.17.18.19.20.21.
免责声明:本文系网络转载或改编,未找到原创作者,版权归原作者所有。如涉及版权,请联系删
武汉格发信息技术有限公司,格发许可优化管理系统可以帮你评估贵公司软件许可的真实需求,再低成本合规性管理软件许可,帮助贵司提高软件投资回报率,为软件采购、使用提供科学决策依据。支持的软件有: CAD,CAE,PDM,PLM,Catia,Ugnx, AutoCAD, Pro/E, Solidworks 等。
 技术文档
技术文档
 推荐好文
推荐好文


 155-2731-8020


