


软件

产品


在Eclipse的IDE环境下,除了可以搭建STM32的编译环境外,还可以配合jlink仿真器实时仿真调试stm32.
首先需要配置下。
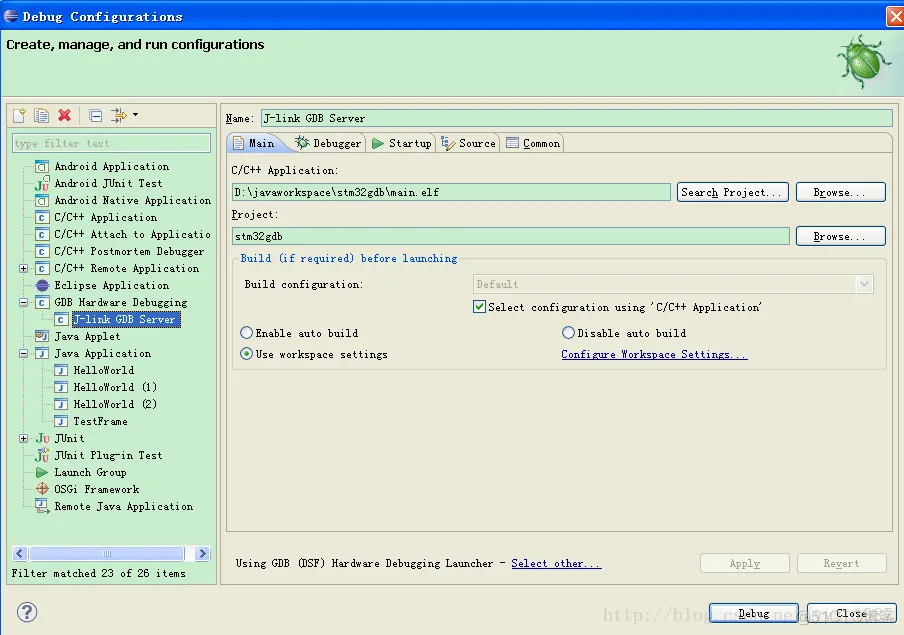
在RUN菜单下的debug configration中,找到GDB Hardware Debugging选项,选择新建,若没有这个选项需要下载这个插件, 地址在
CDT Juno http://download.eclipse.org/tools/cdt/releases/indigo
在新建的选项中,可以命名一个名字,如J-link GDB Server
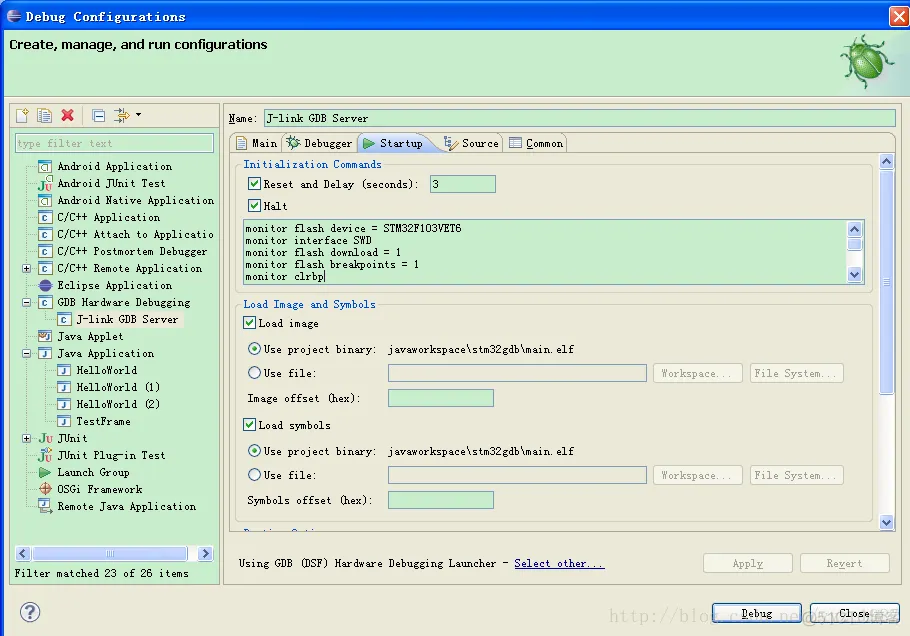
然后配置下如下参数,在startup选项中的,initialization commands中,设下如下内容:
并选择要加载调试的elf文件。
# Enable flash download and flash breakpoints.
# Flash download and flash breakpoints are features of
# the J-Link software which require separate licenses
# from SEGGER.
# Select flash device
    monitor flash device = STM32F103ZE
# Enable FlashDL and FlashBPs
    monitor flash download = 1
    monitor flash breakpoints = 1
# Clear all pendig breakpoints
    monitor clrbp
# Set gdb server to little endian
    monitor endian little
# Set JTAG speed to 5 kHz
    monitor speed 5
# Reset the target
    monitor reset
    monitor sleep 100
# Set JTAG speed in khz
    monitor speed auto
# Vector table placed in Flash
    monitor writeu32 0xE000ED08 = 0x00000000
在Run commands下面的编辑框中填入
monitor reg r13 = (0x00000000)
monitor reg pc = (0x00000004)
break ResetHandler
break main
continue
还没有完,还需要配置下jlink的 GDBServer的位置:
在Run菜单的最后一项 Extrnal tools菜单中,选择Extrnal tools configration,
选择program
配置下GDBserver地址
D:\Program Files\SEGGER\JLinkARM_V408l\JLinkGDBServer.exe
arguments: -if SWD
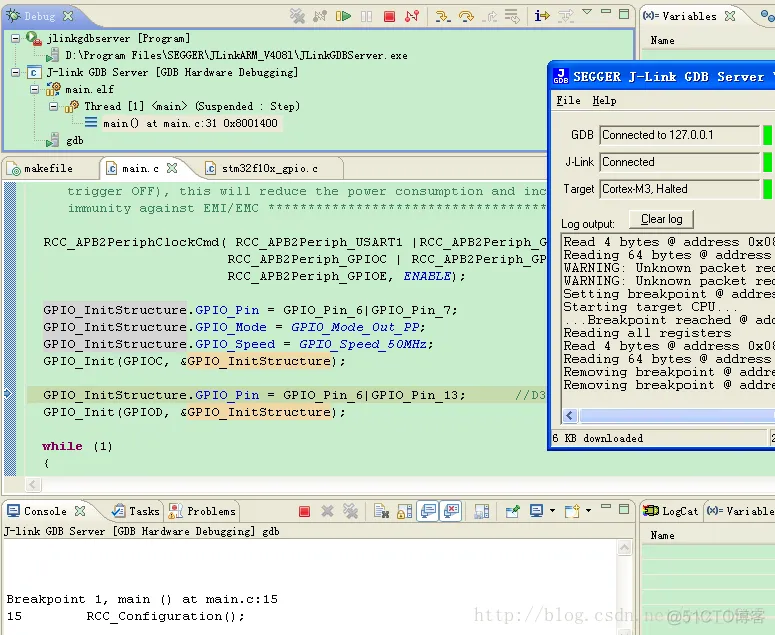
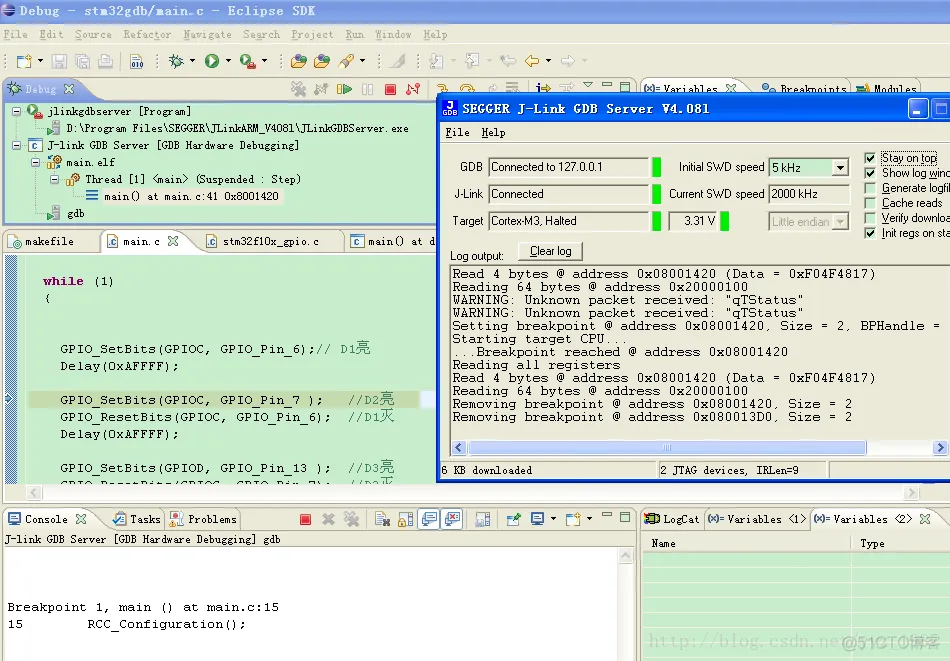
然后再点击Debug就可以仿真调试了。需要注意的是先要启动GdbServer.
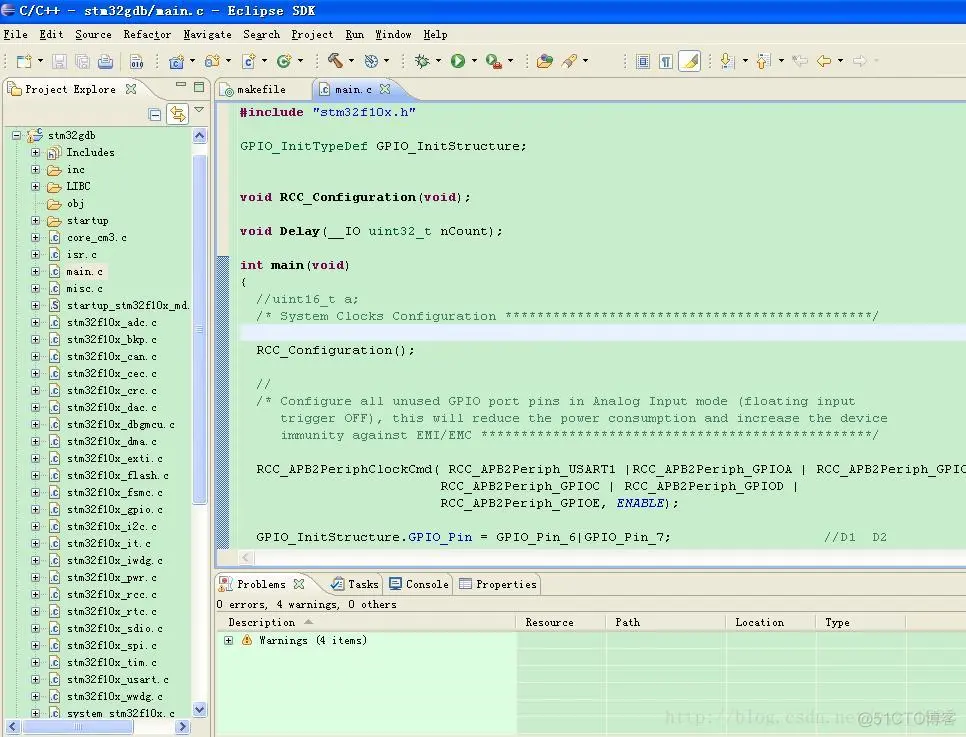
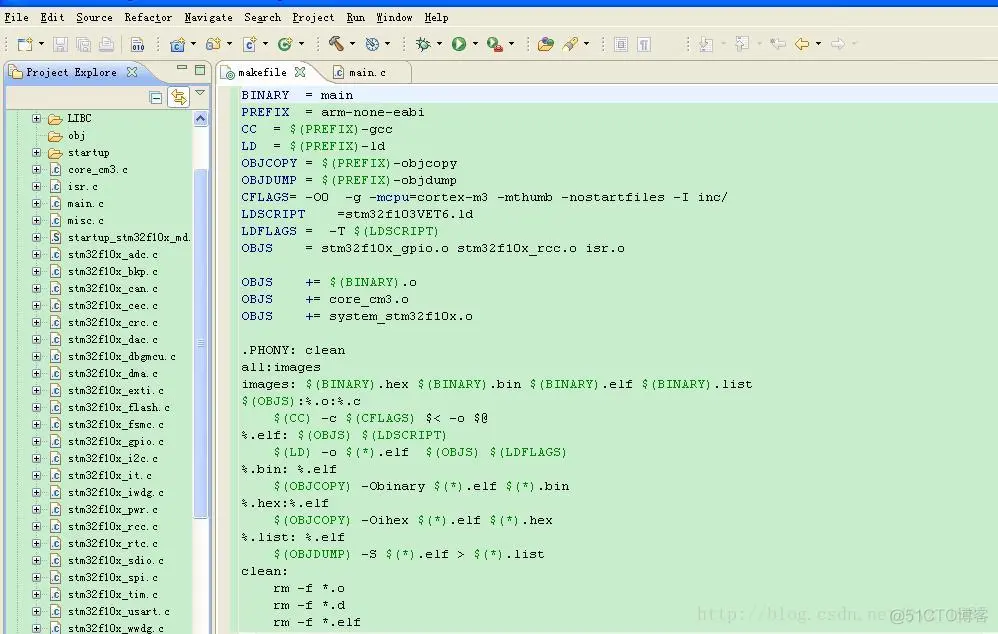
附件:截图和Eclipse配合GDBServer仿真STM32流水灯的例子。例子工程在CSDN资源中。
免责声明:本文系网络转载或改编,未找到原创作者,版权归原作者所有。如涉及版权,请联系删
武汉格发信息技术有限公司,格发许可优化管理系统可以帮你评估贵公司软件许可的真实需求,再低成本合规性管理软件许可,帮助贵司提高软件投资回报率,为软件采购、使用提供科学决策依据。支持的软件有: CAD,CAE,PDM,PLM,Catia,Ugnx, AutoCAD, Pro/E, Solidworks 等。
 技术文档
技术文档
 推荐好文
推荐好文


 155-2731-8020


